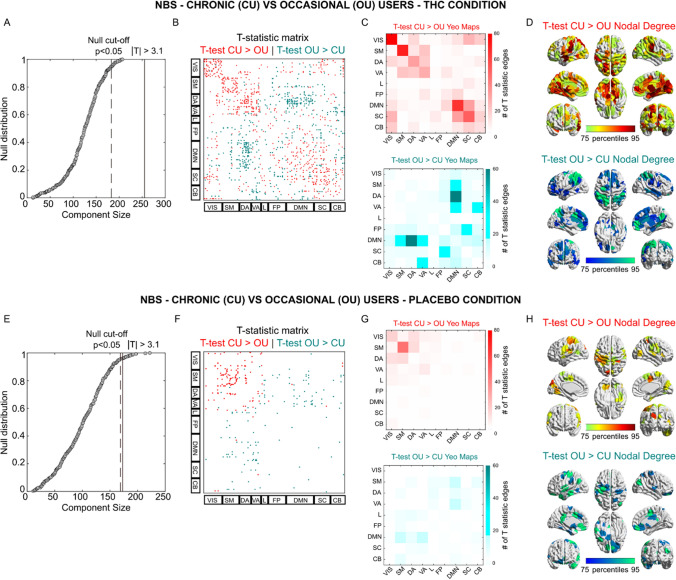
Figure 2.
Network-based analysis of functional connectome changes between occasional and chronic cannabis users in each treatment condition. (B–F) T-statistic matrix threshold at |T|> 3.1 (which corresponds to double-sided p < 0.01) for edgewise group differences between chronic users (CU) and occasional users (OU), during THC (B) or Placebo (F) condition. The brain regions are ordered according to the resting-state network organization proposed by Yeo et al.52 (REF). (A–E) Giant component size extracted from the T-statistic matrix on the observed effect (Red for CU > OU; Teal for OU > CU) and the null distribution obtained by randomly shuffling chronic and occasional functional connectomes. (C–G) Mapping of the significant edges into the 7 functional networks by Yeo et al.52 (REF), with the addition of subcortical and cerebellar networks, for the THC (C) and Placebo condition (G). (D–H) Brain renders reporting the sum of the significant edges where CU > OU and OU > CU, during THC (D) and Placebo (H) condition.

