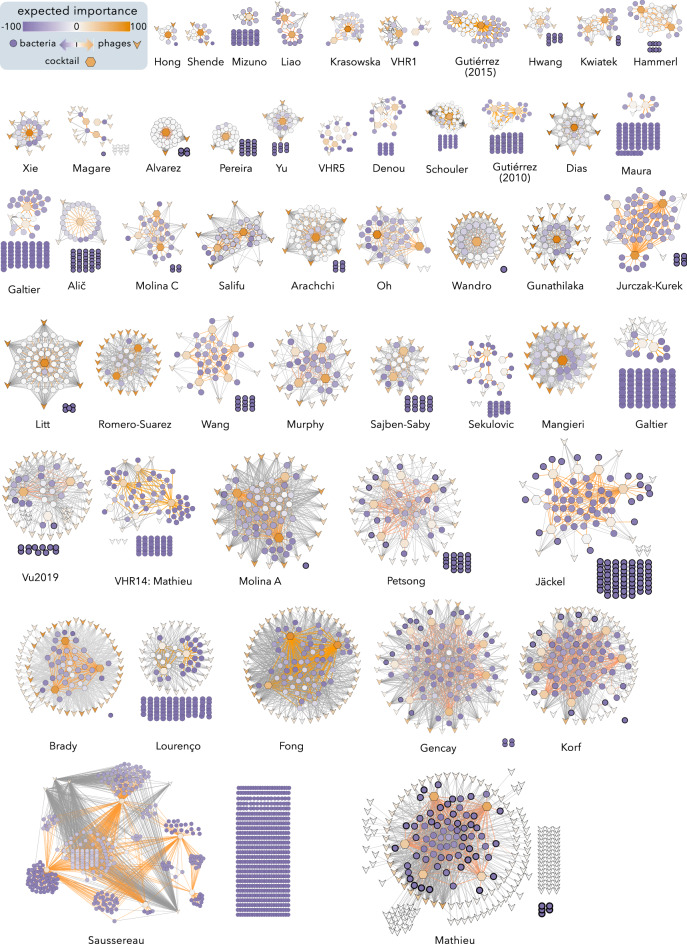
Figure 2.
Graphical representation of Phage Bacteria Infection Networks (PBINs) and candidate Phage Cocktail Networks (PCNs) depicting the Minimum Cocktail Size (MCS). A total of 50 PBINs, each harboring a PCN subnetwork, were built and phage cocktails were designed using an exhaustive algorithm as detailed in Methods and sorted by increasing matrix size (Table 1). The shape of the nodes represents bacteria ( ), unselected phages (
 ) and cocktail phages (
 ). The expected importance (EI) of each node represented by color shading so that more relevant nodes show more intense colors. Bacteria not susceptible to any phage (EIb = -100) are clustered in grids. Lysis is indicated by dark (unselected phages) or orange (phage cocktail) lines.

