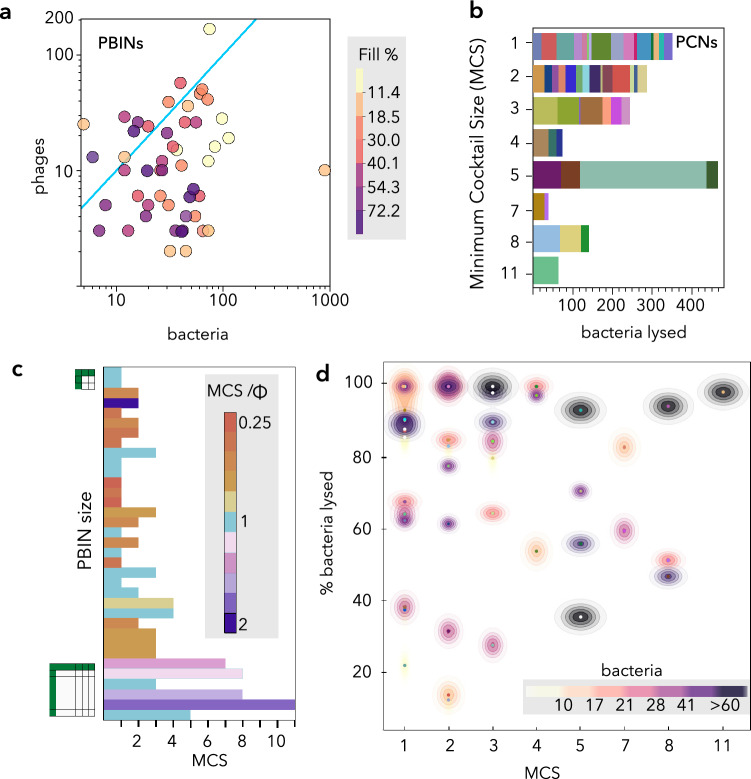
Figure 3.
Characterization of networks (PBINs and PCNs) complexity and expected cocktail efficacy. (A) Analysis of PBINs complexity and symmetry. Each dot represents a single matrix (see Fig. 2) and the fill (%) is represented by color intensity. The cyan line indicates the position of symmetric matrices. (B) Distribution of PCNs grouped by the number of phages (MCS). Each bar sector represents a PCN and its length correlates with the number of bacteria lysed by the cocktail. (C) Comparison of MCS and Φ estimators. 34 PBINs, taken from Molina et al.25, were sorted by decreasing size. Bar length indicates the MCS, whereas color corresponds to the MCS/Φ ratio. (D) Expected cocktail efficacy vs. MCS. The fraction (%) of bacteria susceptible to at least one phage of the cocktail is shown for every PBIN. The number of bacteria is grouped by percentiles and represented by a density plot.

