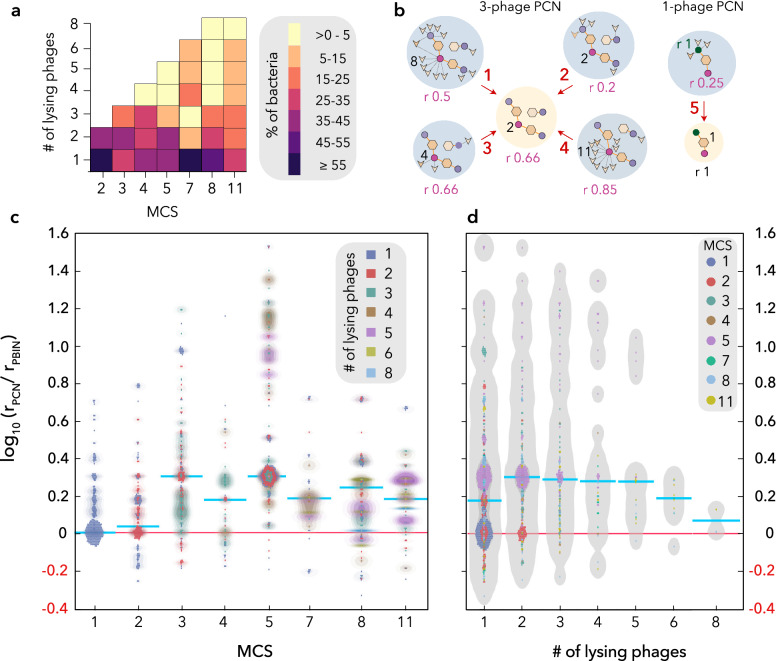
Figure 4.
Analysis of phage-phage interactions: PBINs vs. PCNs. (A) Number of phages lysing bacterial strains for each cocktail size. The PCNs were grouped by MCS values and the fraction (%) of bacterial strains lysed by different number of phages is shown as a heatmap. (B) Examples of redundancy variations. Original PBINs and resulting PCNs are represented by blue and yellow shaded circles, respectively. Redundancy (r), the fraction of phages infecting a bacterial strain, is shown for one specific strain (red circle) in five PBINs and two PCNs. Additionally, the redundancy of a second strain is shown in PBIN #5. Examples of redundancy increase (1, 2, 5  ), constancy (3
  ; 5
; 5  ) and decrease (4
  ) are shown. (C) Redundancy variation (rv) of phage-host networks. PCNs were grouped by MCS and the redundancy change of the bacterial strains is represented as dots and density lines. The color indicates the number of lysing phages. The median of each distribution is shown by a cyan line. (D) Redundancy variation (rv) vs. number of lysing phages. Bacterial strains (dots) were grouped by the expected number of lysing phages and highest density region (HDR) box plots were generated. The color of the different dots indicates the MCS values and the cyan line represents the median of each distribution.

