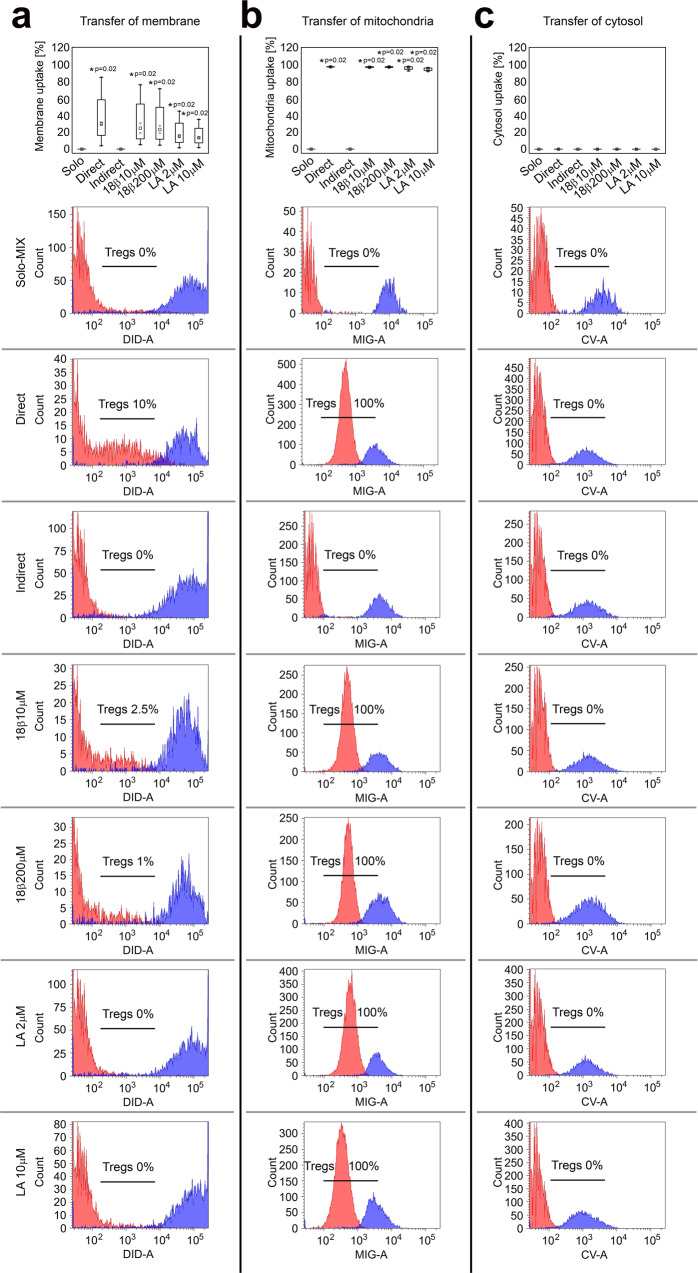
Fig. 4. Tregs uptake plasmalemma and mitochondria, but not cytosol from allogeneic ASCs when present in direct cell-to-cell contact.
Plasmalemma, mitochondria and cytosol of allogeneic ASCs were stained with a Vybrant DiD (DID), b mitotracker green (MIG) and c calcein violet (CV), respectively. Unstained Tregs cultured separately served as a negative control (Solo-MIX, n = 4) and were mixed with stained ASCs immediately before the analysis with flow cytometry to show Treg autofluorescence and fluorescence of labelled ASCs on the same graph. Simultaneously, stained ASCs were cocultured with unstained Tregs for 72 h in direct (Direct, n = 4) and indirect (Indirect, n = 4) contact. In addition, the effect of 18β-glycyrrhetinic acid (18β 10 μM, n = 4 and 18β 200 μM, n = 4) and latrunculin A (LA 2 μM, n = 4 and LA 10 μM, n = 4) inhibitors of gap junction and tunnelling nanotube formation, respectively was tested in direct cocultures. Graphs depict the percentage of Tregs that internalized ASC-derived cellular elements. Histograms from one representative experiment are shown. Red and blue histograms represent the fluorescence of unstained Tregs and stained ASCs, respectively. Cellular element uptake is visible as an increase in the fluorescence of unstained Tregs after coculture with labelled ASCs. The frequency of Tregs that internalized ASC-derived element is shown on each histogram. Data for four independent experiments were calculated using a two-sided Mann–Whitney U test with correction. *p < 0.05 for direct cocultures with and without inhibitors vs monocultures and indirect cocultures. In all boxplots the median is indicated by the symbol within the box, lower and upper bounds of the boxes correspond with the 25th and 75th percentiles. The lower and upper whiskers indicate the minimum and maximum values, respectively. Source data are provided as a Source Data file.

