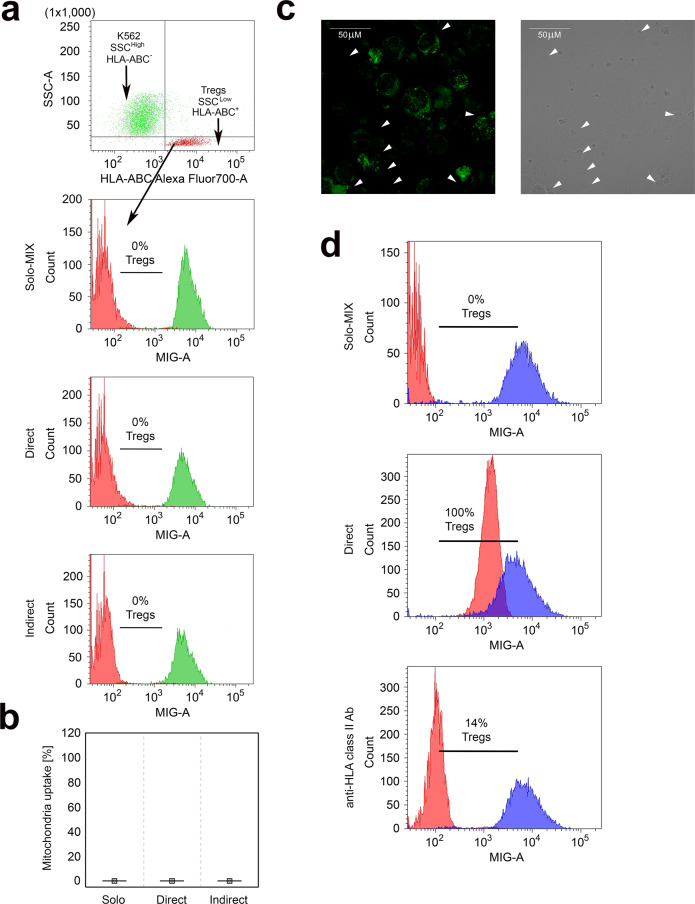
Fig. 6. Treg mitochondria uptake is HLA dependent.
The figure depicts the lack of mitochondria transfer from K562 cells to Tregs. a The gating strategy for identification of K562 cells (HLA-ABC−SSCHigh) and Tregs (HLA-ABC+SSCLow) in the coculture experiments for mitochondria transfer analysis, where K562 cells were stained with mitotracker green dye (MIG). In the next step gated K562 cells and Tregs were visualized on histograms for MIG fluorescence to measure mitochondria transfer from MIG stained K562 cells (green histograms) to unstained Tregs (red histograms). Unstained Tregs cultured separately served as a negative control (Solo-MIX, n = 4) and were mixed with stained K562 cells immediately before the analysis with flow cytometry to display Treg autofluorescence and fluorescence of labelled K562 on the same graph. Simultaneously, stained K562 cells were cocultured with unstained Tregs for 72 h in direct (Direct, n = 4) and indirect (Indirect, n = 4) contact. Histograms from one representative experiment are shown. Percentage of Tregs that internalized K562 cell-derived mitochondria is given for each histogram. b The frequency of Tregs that have taken up mitochondria from K562 cells (n = 4). c Representative confocal micrographs from 1 of 2 experiments show K562 cells labelled with MIG and unstained allogenic Tregs that did not incorporate mitochondria from K562 cells after coculture in direct cell-to-cell contact. Tregs are highlighted by the arrows on the light and green fluorescence micrographs. Tregs would show green fluorescence if K562 cell-derived mitochondria were incorporated. The image was acquired with ×60 oil immersion objective lens. d Inhibition of Treg mitochondria uptake after ASC preincubation with blocking anti-HLA class II antibody. Unstained Tregs cultured separately served as a negative control (Solo-MIX) and were mixed with stained ASCs immediately before the analysis to depict Treg autofluorescence and fluorescence of labelled ASCs on the same graph. Simultaneously, stained and anti-HLA class II blocking antibody treated (anti-HLA class II Ab) and not treated (Direct) ASCs were cocultured with unstained Tregs for 72 h in direct cell-to-cell contact. Graphs depict the percentage of Tregs that internalized ASC-derived mitochondria. Data were calculated with a two-sided Mann–Whitney U test with correction. In the statistical plots the median is indicated by the symbol. No boxes and no whiskers are visible as each time the values were equal to zero. Source data are provided as a Source Data file.

