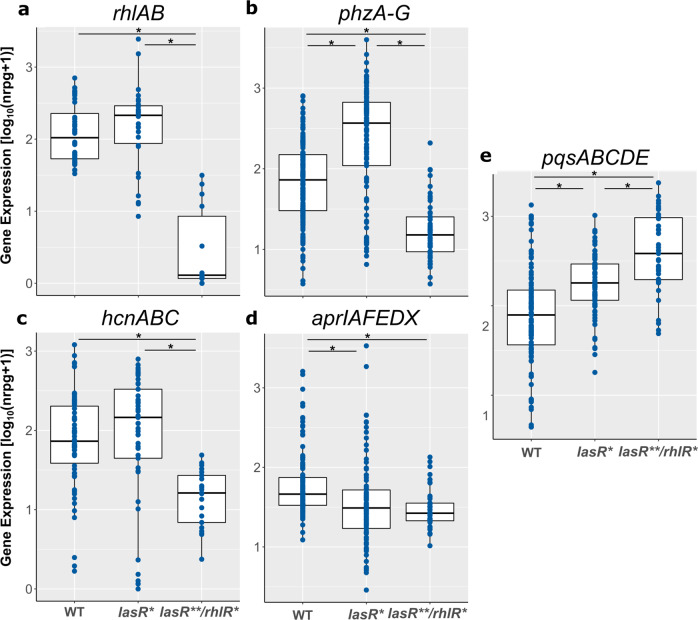
Fig. 5. Expression of lasR regulon genes in clinical lasRWT, lasR* and lasR**/rhlR* isolates under biofilm growth conditions.
Expression values (log10(nrpg + 1)) of a rhlAB, b phzABCDEFG, c hcnABC, d aprIAFEDX, e pqsABCDE in lasRWT (n = 22), lasR* (n = 15), and lasR**/rhlR* (n = 7) clinical isolates under biofilm growth conditions are depicted. Asterisk: p-value < 0.05, Wilcoxon rank sum test or Welch’s t-test. Boxplot elements are: center line—median; box limits—upper and lower quartiles; whiskers—1.5× interquartile range; points—gene expression values (log10(nrpg + 1)). Reads are shown as log10 normalized million reads per gene.

