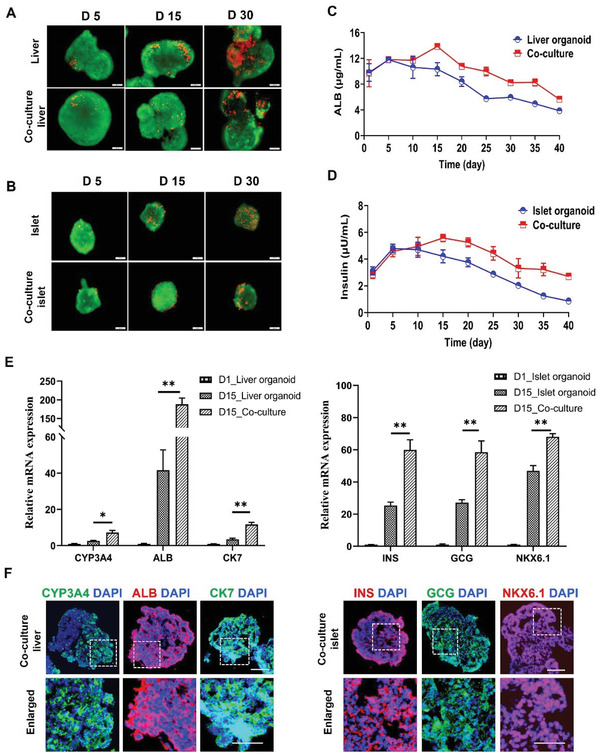
Figure 3.

Comparison of cell viability and functionality of liver and islet organoids under mono‐ and co‐culture conditions. A,B) Liver and islet organoids were stained with a live/dead kit on days 5, 15, and 30 during the prolonged culture period. C,D) Examination of albumin secretion by liver organoids and insulin secretion by islet organoids under different culture conditions from days 1 to 40. E) Quantification of relative mRNA expression levels of liver‐specific genes (CYP3A4, ALB, and CK7) and islet‐associated genes (NKX6.1, INS, and GCG) in organoids at day 15 using RT‐PCR in mono‐ and co‐culture groups. Expression values were normalized to GAPDH. Relative expression is represented as the mean ± SEM, three independent experiments were performed. The data were analyzed using Student's t‐test, *p < 0.05, **p < 0.01, and ***p < 0.001. F) Immunohistochemical staining of CYP3A4 (red), ALB (red), and CK7 (green) in liver organoids and NKX6.1 (red), INS (red), and GCG (green) in islet organoids at day 15. DAPI was used to stain the nuclei (blue). Scale bars: 100 µm. Enlarged views are shown below each image. Scale bars: 20 µm.
