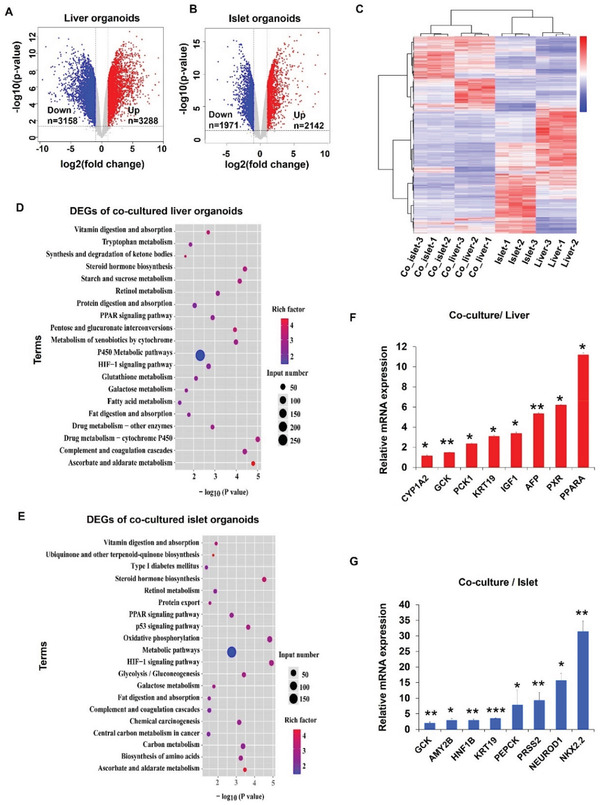
Figure 4.

Transcriptomic analysis of liver and islet organoids in the multi‐organoid‐on‐chip system at day 15. A,B) Volcano plots of the significantly DEGs in liver and islet organoids in co‐cultures compared to mono‐cultures. Genes differentially expressed with fold change over 2.0 and p<0.05 were marked in color. P values were calculated using a two‐sided, unpaired student's t‐test with equal variance assumed (n = 3 independent biological samples). C) Hierarchical clustering heat map for DEGs between mono‐ and co‐cultured liver and islet organoids. Three repeats were performed. The gradient color scale at the right top indicates the log2(fold change) in the expression of the treatment case compared with the control case. D,E) KEGG functional classification of the liver and islet organoid DEGs under mono‐ and co‐culture conditions at day 15. The color of the dots represents the rich factor, while the size represents the input number of genes for each KEGG term. The horizontal axis indicates the significance of enrichment (−log10 (p‐value)). F,G) Validation of selected DEGs identified by RNA‐seq using qRT‐PCR. The expression values were normalized to GAPDH. Data were normalized against mono‐culture expression values and are shown as mean ± SEM, three independent experiments were performed.
