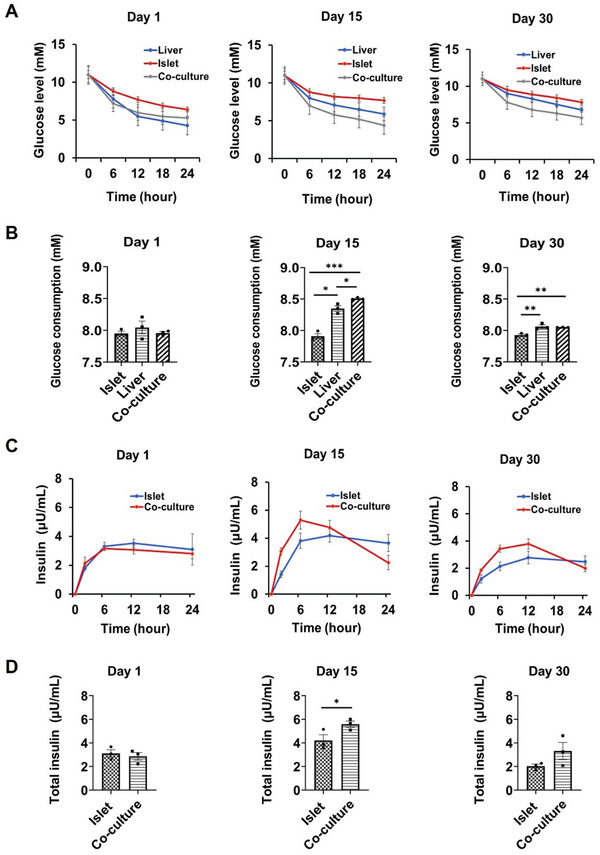
Figure 5.

Characterization of the interplay between liver and islet organoids in a perfused multi‐organoid chip system. A) Dynamic glucose levels were quantified using a GTT at days 1, 15, and 30 in mono‐ and co‐cultures. Medium containing 11 mm glucose was injected into the mono‐ or co‐culture systems. B) Area under the glucose consumption curve on days 1, 15, and 30. C) Insulin secretion by pancreatic organoids during GTT under different conditions on days 1, 15, and 30. D) Area under the insulin response curve on days 1, 15, and 30. The data were analyzed using Student's t‐test or a one‐way analysis of variance (ANOVA) test and are shown as the mean ± SEM, three independent experiments were performed. *p < 0.05, **p < 0.01, and ***p < 0.001.
