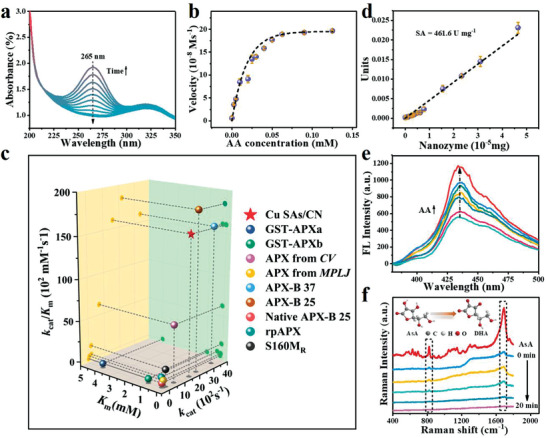
Figure 2.

Characterizations of the APX‐like performance of Cu SAs/CN. a) Time‐dependent ultraviolet–vis (UV–vis) absorption spectra in the presence of Cu SAs/CN, AsA, and H2O2. b) Michaelis–Menton curves by varying AsA concentration at a constant concentration of H2O2. c) The specific activities (SA) of Cu SAs/CN. The SA is determined by plotting the APX‐like activities against the weight. SA value is obtained from the slope of the resultant straight lines. d) Comparison of the kinetic constants (K m, k cat, and k cat/K m) based on Cu SAs/CN, natural APXs, and APX mutants for AsA substrate. e) Fluorescence spectra of OPDA‐Cu SAs/CN with increasing concentrations of AsA. f) The in situ Raman spectra during APX‐like catalytic oxidation of AsA molecules on Cu SAs/CN in the presence of H2O2 at different time intervals. Inset image reflects the oxidation of AsA molecules by Cu SAs/CN with the presence of H2O2.
