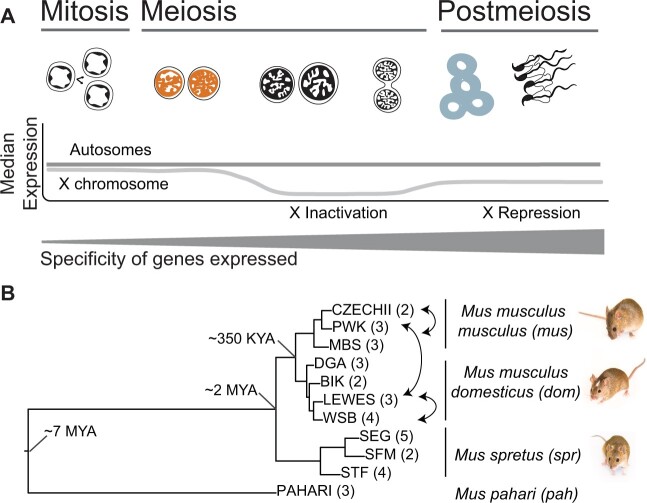
Fig. 1.
(A) Predictive framework depicting the major stages of spermatogenesis and expected relative expression levels of the X chromosome and autosomes at each stage (Namekawa et al. 2006). The two cell populations used in this study are leptotene-zygotene (“early,” second from left, orange) and round spermatids (“late,” second from right, blue). The relative thickness of the gray bar represents the predicted cell type specificity at each stage (Eddy 2002; Chalmel et al. 2007; Larson et al. 2016; Green et al. 2018). (B) Maximum likelihood tree of concatenated exome data from the four Mus species or subspecies used in this study: Mus musculus musculus (mus), Mus musculus domesticus (dom), Mus spretus (spr), Mus pahari (pah). Tips are labeled with the inbred strains from each lineage, with select crosses used to generate F1 hybrids indicated with arrows. Number of individuals sampled for each strain indicated in parentheses. Approximate divergence times are placed at each major node (Chevret et al. 2005). All nodes had 100% bootstrap support.

