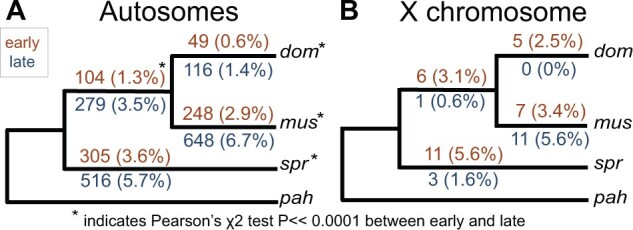
Fig. 2.

Number of genes that were lineage-specific on each internal branch of the mouse phylogeny used in this study. Numbers in parentheses are the percent of active genes that were lineage-specific. Results are presented separately for the autosomes (A) and X chromosome (B). Orange values above each branch represent the early cell type and blue values below represent the late cell type. Asterisks indicate a significant difference between early and late on that branch based on a Pearson’s χ2 test.
