
Fig. 3.
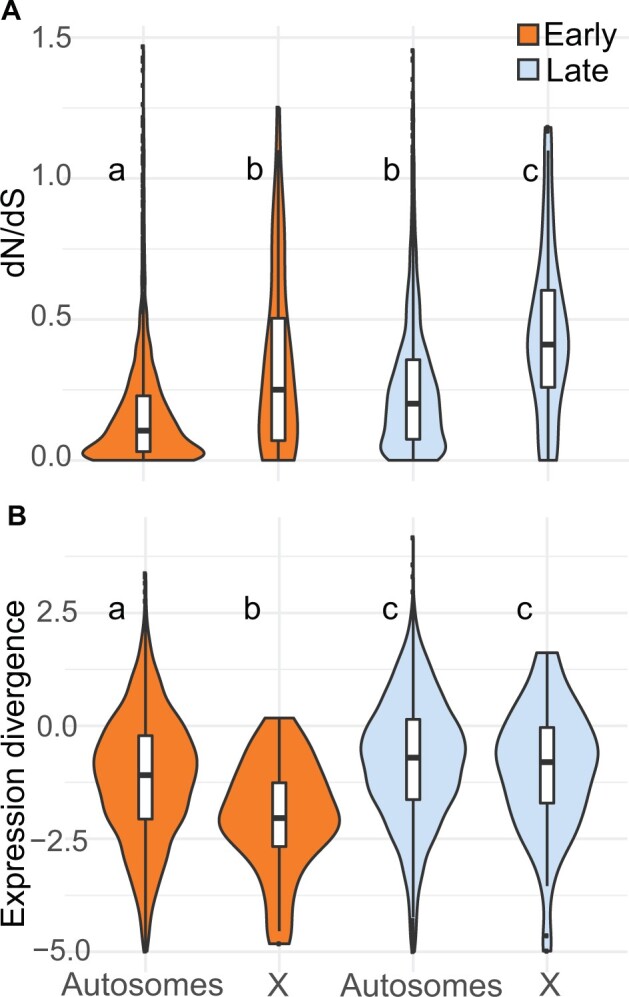
(A) Protein-coding and (B) expression divergence on the autosomes and X chromosome for genes induced in each cell type. Expression divergence values on the y-axis are , where betai is the measure of expression divergence from EVE. Higher values on the y-axis represent higher divergence. The center of each violin plot is a standard boxplot, with the center horizontal line representing the median divergence value. The violins show the probability density of divergence values for each group. A wider part of the violin at a given value means genes expressed in that group are more likely to have that divergence value. The letters above each violin indicate significant differences between the cell types and chromosome types based on a Wilcoxon rank sum test.