Figure 2.

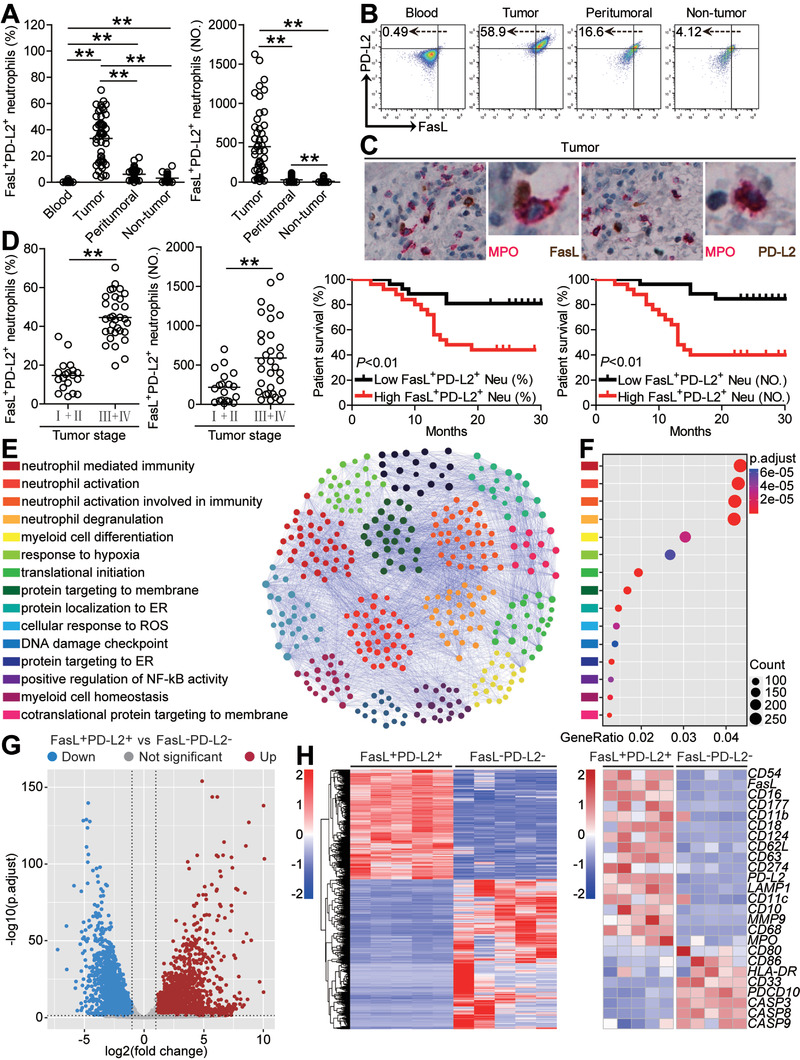
FasL+PD‐L2+ neutrophil subset with a unique phenotype is increased in GC as tumor progresses and predicts poor patient survival. A) Statistics analysis of FasL+PD‐L2+ neutrophil percentage in total neutrophils or FasL+PD‐L2+ neutrophil number per million total cells in each samples of patients with GC (n = 51). B) Dot plots of surface molecule staining for FasL+PD‐L2+ neutrophils gating on CD45+CD11b+CD66b+CD15+ cells. C) Representative image of MPO+FasL+ neutrophils and MPO+PD‐L2+ neutrophils in tumor tissues of GC patients by immunohistochemical staining. D) FasL+PD‐L2+ neutrophil percentage and FasL+PD‐L2+ neutrophil number among TNM stages was compared. Kaplan‐Meier plots for overall survival by median FasL+PD‐L2+ neutrophil percentage (36.8) and FasL+PD‐L2+ neutrophil number (306). E) PPI network analysis of significantly changed genes from top 15 gene ontology terms in tumor‐infiltrating FasL+PD‐L2+ neutrophils, as compared with peripheral FasL−PD‐L2− neutrophils. F) Gene ontology analysis of significantly changed genes in tumor‐infiltrating FasL+PD‐L2+ neutrophils, as compared with peripheral FasL−PD‐L2− neutrophils. G) Differentially expressed genes between tumor‐infiltrating FasL+PD‐L2+ neutrophils and peripheral FasL−PD‐L2− neutrophils are shown. H) Heatmap revealing gene changes between tumor‐infiltrating FasL+PD‐L2+ neutrophils and peripheral FasL−PD‐L2− neutrophils from five GC patients. Data are mean ± SEM and analyzed by Student's t‐test, Mann‐Whitney U‐test, and one‐way ANOVA. *P < 0.05, **P < 0.01 for groups connected by horizontal lines. MPO, myeloperoxidase; FasL+PD‐L2+ Neu (%), FasL+PD‐L2+ neutrophil percentage; FasL+PD‐L2+ Neu (NO), FasL+PD‐L2+ neutrophil number.
