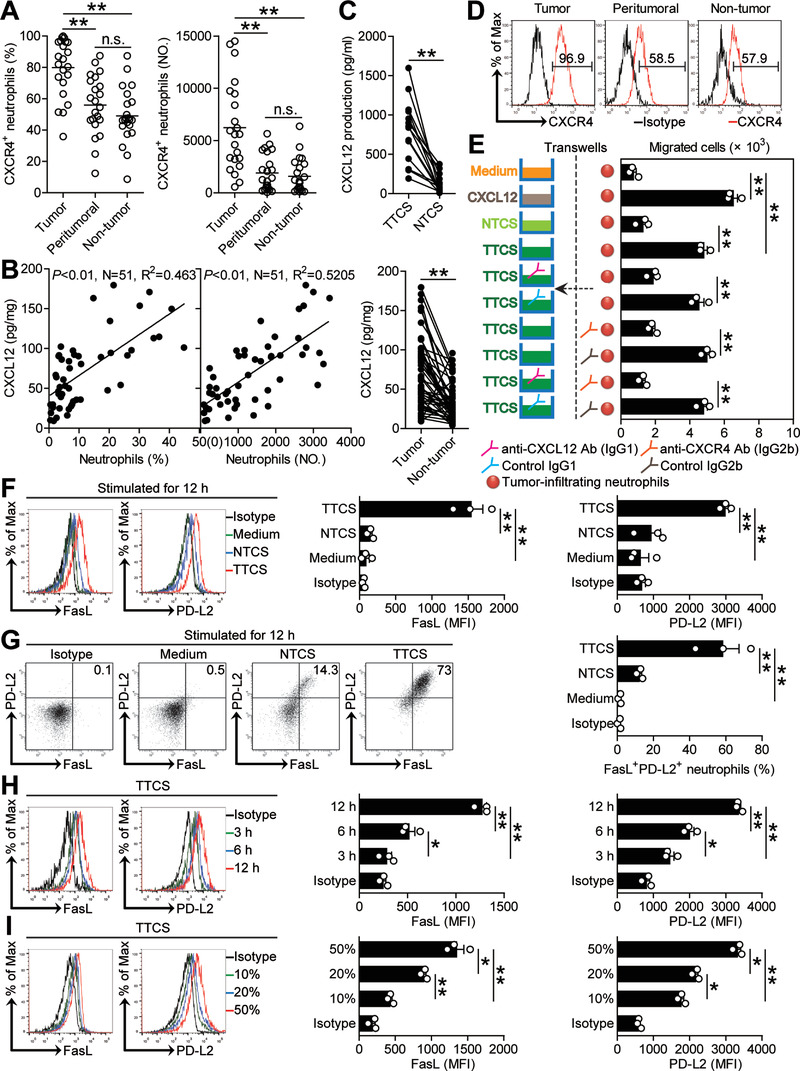
Figure 3.

Human GC environments contribute to neutrophil infiltration and induce FasL+PD‐L2+ neutrophil subset. A) Statistics analysis of CXCR4+ neutrophil percentage in total neutrophils and the number of CXCR4+ neutrophils per million total cells in each samples of patients with GC by gating on CD45+CD11b+CD66b+CD15+CXCR4+ cells and counting (n = 23). B) The correlations between neutrophils and CXCL12 in GC tumors were analyzed. C) CXCL12 concentration between autologous tumor and non‐tumor tissues (n = 51) or between autologous TTCS and NTCS (n = 14) was analyzed. D) Expression of molecule CXCR4 on neutrophils. Color histograms represent staining of CXCR4. E) Migration of tumor‐infiltrating neutrophils was assessed by Transwell assay as described in the Experimental Section and statistically analyzed (n = 3). F) Representative data and statistical analysis of the expression of FasL and PD‐L2 on neutrophils exposed to 50% autologous TTCS and NTCS for 12 h. G) Representative data and statistical analysis of the induction of FasL+PD‐L2+ neutrophils exposed to 50% autologous TTCS and NTCS for 12 h. H) Representative data and statistical analysis of the expression of FasL and PD‐L2 on neutrophils exposed to 50% TTCS for 3, 6, and 12 h. I) Representative data and statistical analysis of the expression of FasL and PD‐L2 on neutrophils exposed to 10%, 20%, and 50% TTCS for 12 h. Data are mean ± SEM and analyzed by Student's t‐test, Mann‐Whitney U‐test, and one‐way ANOVA. *P < 0.05, **P < 0.01 for groups connected by horizontal lines. MFI: mean fluorescence intensity.
