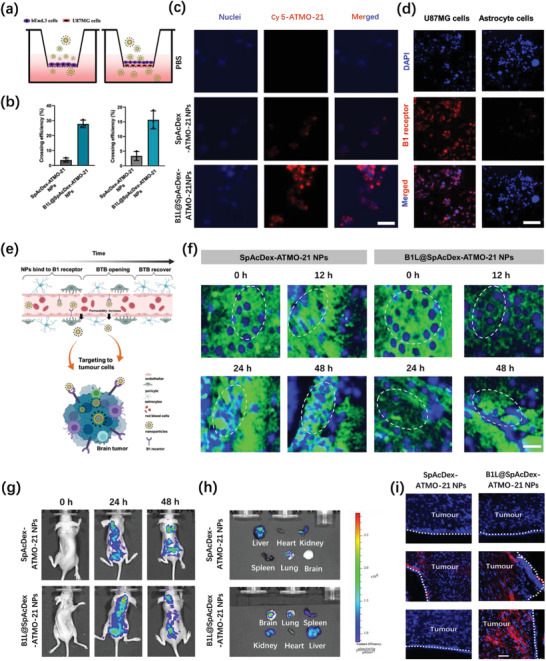
Figure 5.

In vitro and in vivo evaluation of B1L‐mediated NP transport across the BBB and BTB. a) In vitro BBB and BTB model. b) The crossing efficiency of NPs (SpAcDex‐ATMO‐21 NPs and B1L@SpAcDex‐ATMO‐21 NPs) toward the BBB and BTB. Data are presented as means ± SD (n = 3). c) U87MG cell uptake within the basolateral chamber measured by CLSM. Scale bar, 20 µm. d) The expression of the B1 receptor (red fluorescence) on U87MG cells and human astrocytes visualized by CLSM. Scale bar, 20 µm. e) Proposed mechanism of B1L (agonist)‐mediated as‐fabricated NPs crossing the BBB and BTB. Modified icons from BioRender.com. f) The expression of endothelial cell (EC)‐associated tight junction protein ZO‐1 (green fluorescence) in tumor sections after treatment with SpAcDex‐ATMO‐21 NPs and B1L@SpAcDex‐ATMO‐21 NPs and measured via CLSM at different time points (0, 12, 24, and 48 h). Scale bar, 20 µm. g) Real‐time fluorescence imaging of brain tumor‐bearing mice after intravenous injection with SpAcDex‐ATMO‐21 NPs and B1L@SpAcDex‐ATMO‐21 NPs. During the in vivo fluorescence imaging, 3 mice per group were used as imaging objects. The fluorescence intensity at the mouse brain site was recorded using a small animal imager machine at 0, 24, and 48 h postinjection of as‐fabricated NPs. h) CLSM images (ex vivo) of major organs and brain tumors at 48 h postinjection. The heart, liver, spleen, lung, kidney, and brain were excised from each group of three mice after the fluorescence imaging. The fluorescence intensity at each organ was recorded separately. i) The accumulation of SpAcDex‐ATMO‐21 NPs and B1L@SpAcDex‐ATMO‐21 NPs in the brain tumor site 48 h postinjection of SpAcDex‐ATMO‐21 NPs and B1L@SpAcDex‐ATMO‐21 NPs. Scale bar, 20 µm.
