FIGURE 1.

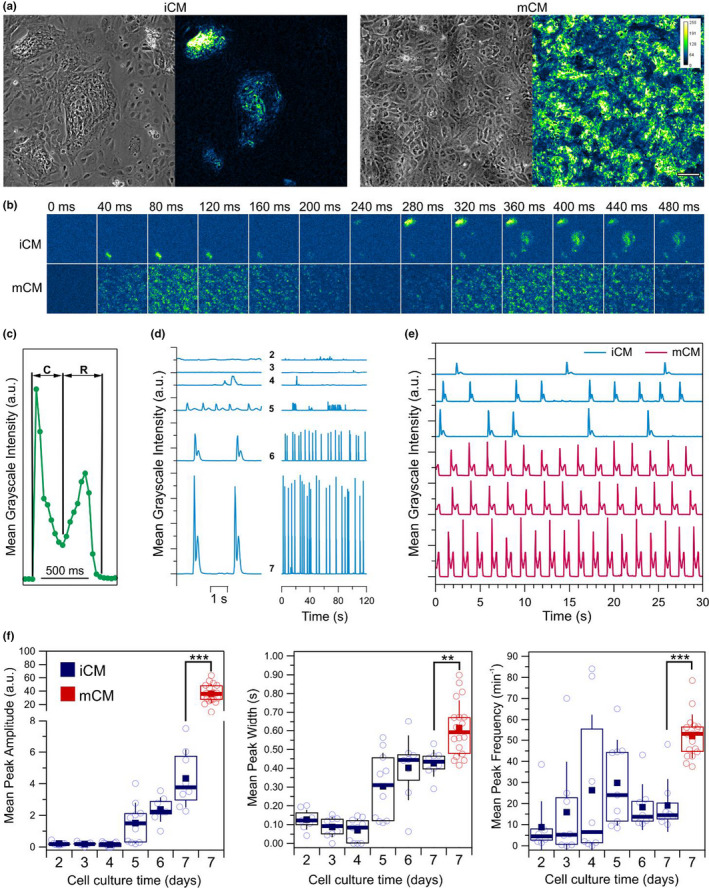
Motion analysis of iCM and mCM cardiomyocyte monolayers. (a) Typical phase‐contrast images (left) and time‐integrated motion signals over a 1 min period (right) for iCM and mCM monolayers. Cells in iCM cultures tend to form tight cell clusters that often exhibited contractile motion, while in mCM motion activity was typically more homogeneously distributed. Color scale denoting signal intensity, and scale bar of 100 µm are applicable to all respective subpanels. (b) Output of the motion detection over 13 consecutive frames spanning a period of 480 ms for the examples shown in (a) reveals differences in motion synchronicity within iCM and mCM monolayers. Motion in mCM monolayers clearly display two moments related to a contraction and a relaxation phases, which in iCM were typically more well defined at the level of the individual cell clusters rather than between clusters. (c) A typical spatially averaged contractile motion signal displays two moments related with the contraction (C) and relaxation (R) phases. Each point corresponds to the mean motion signal intensity across the imaged field of view. (d) Evolution of motion signals in iCM monolayers across different days of culture indicate an increase in contraction frequency and increased levels of motion across the monolayer. (e) Comparison of motion traces between iCM and mCM on the seventh day of culture. (f) Evolution of the mean motion peak amplitude, width, and frequency as a function of cell culture period for iCM and mCM. In plots, open circles represent mean values obtained from a single motion trace over a period of 120 s (n = 8), boxes show the interquartile range, error bars show standard deviation, filled squares and thick horizontal lines indicate means and medians, respectively. Statistical significance assessed by the Student's t test (**p < 0.01; ***p < 0.001)
