FIGURE 2.

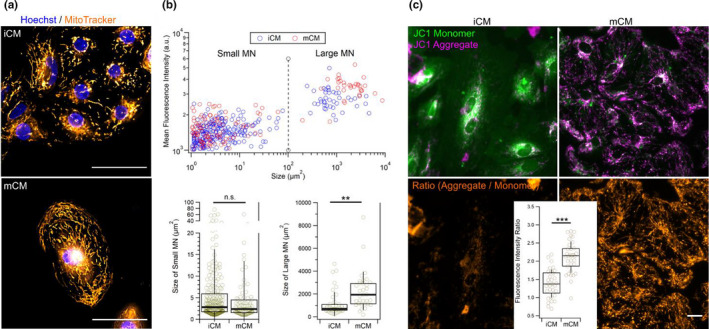
Live cell fluorescence imaging of mitochondria. (a) Live cell imaging with the membrane potential independent mitochondrial probe MitoTrackerTM Green FM shows topographical and morphological differences in mitochondrial networks. Mitochondria in iCM typically accumulate in the perinuclear region while in mCM they also span toward the cellular cortex. Scale bar is 50 µm and applies two both subpanels. (b) Direct correlation between the size of mitochondrial networks (MN) and their mean fluorescence intensity when imaged with MitoTrackerTM Green FM allows classification of MN into small and large MN with sizes of up to 100 µm2, and above 100 µm2, respectively (top). Comparing the sizes of mitochondrial networks (MN) between iCM and mCM shows that large MNs in mCM are significantly larger, but no significant size differences were found for small MNs (bottom). (c) Live cell imaging of cells labeled with JC‐1 mitochondrial membrane potential‐dependent fluorescence probe reveals clear differences between iCM and mCM in signals from JC‐1 monomers and JC‐1 aggregates shown in composite images (top). Analysis of ratio image intensities (bottom) indicates significantly higher activities in mCM mitochondria. Scale bar is 20 µm and applies to all subpanels. Statistical significance assessed by the Student's t test (**p < 0.01; ***p < 0.001; n.s., non‐significant)
