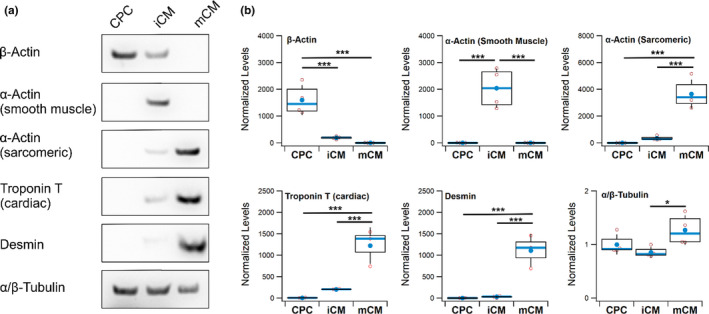
FIGURE 3.

Western Blot detection of cytoskeletal proteins. (a) Typical Western Blots obtained for six different cytoskeletal proteins in samples of cardiac progenitor cells (CPC), immature (iCM) and more differentiated (mCM) cardiomyocytes. (b) Evaluation of the differences in expression across three to four biological replicates. Variations in protein load were corrected using total protein derived from Ponceau S staining of the blotted membranes and final results are presented normalized to the mean expression of the CPC samples, except for β‐actin where the mean of the mCM sample was used. In boxplots, the box corresponds to the interquartile range, error bars show standard deviation, with mean and median represented by a filled circle and centerline, respectively. Statistical analysis performed with ANOVA followed by Tukey's HSD pairwise multi‐comparison test (*p < 0.05; ***p < 0.001)
