FIGURE 4.

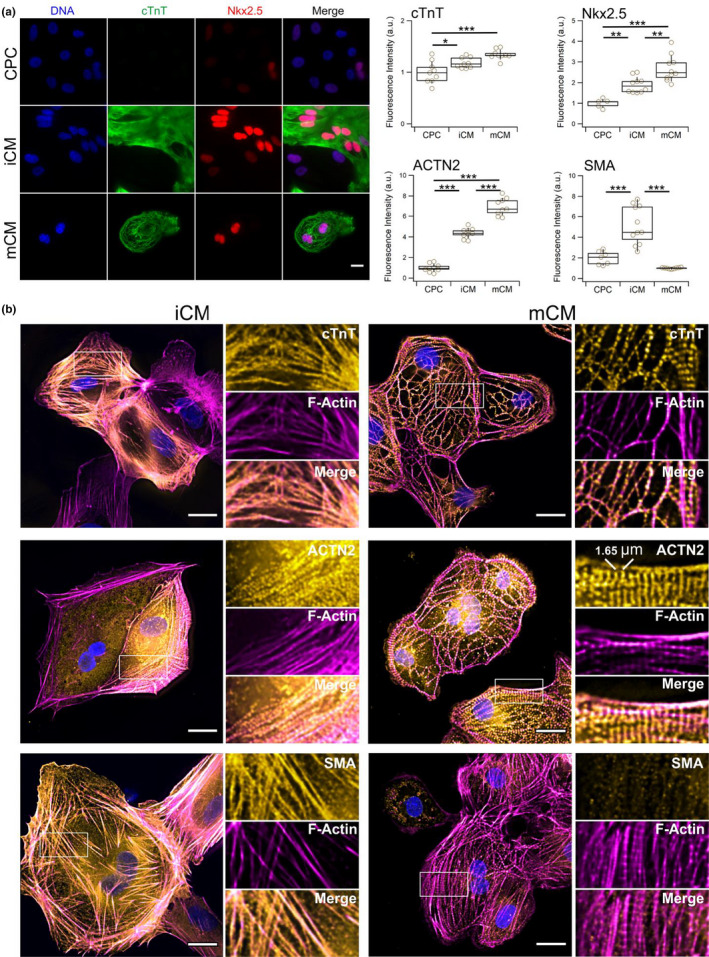
Detection of cardiomyocyte and cytoskeletal markers by fluorescence microscopy. (a) Fluorescence microscopy images of cardiac troponin T (cTnT) and Nkx2.5 for samples of cardiac progenitor cells (CPC), and immature (iCM) and more differentiated (mCM) cardiomyocytes (left) and image‐based quantification of cTnT, Nkx2.5, sarcomeric α‐actinin (ACTN2), and smooth muscle α‐actin (SMA) (right). Results suggest that iCM are an intermediary state of differentiation between CPC and mCM uniquely displaying high levels of SMA. Scale bar is 20 µm applicable to all subpanels. In boxplots, n = 9 for each sample, boxes indicate interquartile range, error bars show standard deviation. (b) Composite fluorescence microscopy images of iCM and mCM cardiomyocytes labeled for F‐Actin with rhodamine‐phalloidin and immunolabeled for cardiac troponin T (cTnT), sarcomeric α‐actinin (ACTN2), smooth muscle α‐actin (SMA). Insets show a magnified view of single channel information from the highlighted rectangular areas. All markers display high levels of integration within the F‐actin cytoskeletal network, however, recognizable patterns typical of more differentiated cardiomyocytes are typically apparent in mCM. Scale bars are 20 µm. Statistical analysis performed with ANOVA followed by Tukey's HSD pairwise multi‐comparison test (*p < 0.05; **p < 0.01; ***p < 0.001)
