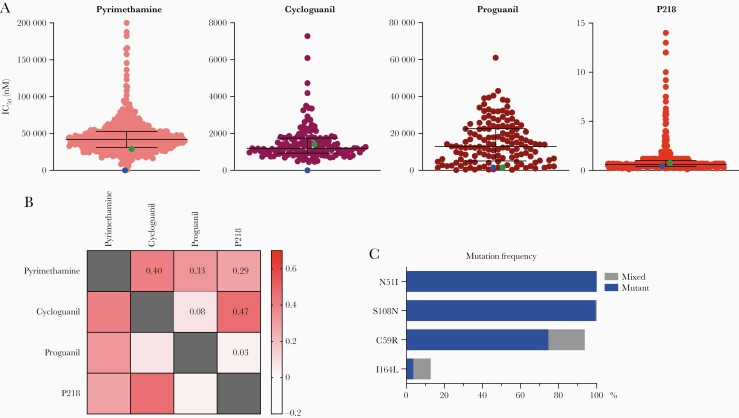
Figure 1.
Susceptibilities to tested inhibitors, correlations of susceptibilities, and genotypes of Ugandan isolates. (A) Ex vivo susceptibilities of Ugandan Plasmodiumfalciparum isolates. Each point represents an individual isolate. Horizontal bars show medians and interquartile ranges. Green and blue points show means for Dd2 and 3D7 strain parasites, respectively. (B) Heat map demonstrating correlations. Spearman’s coefficients (r) are indicated numerically and by the color scale. (C) Mutation frequencies. Frequencies, including isolates with pure mutant (blue) and mixed wild-type/mutant (gray) genotypes, are shown. IC50, half-maximal inhibitory concentration.

