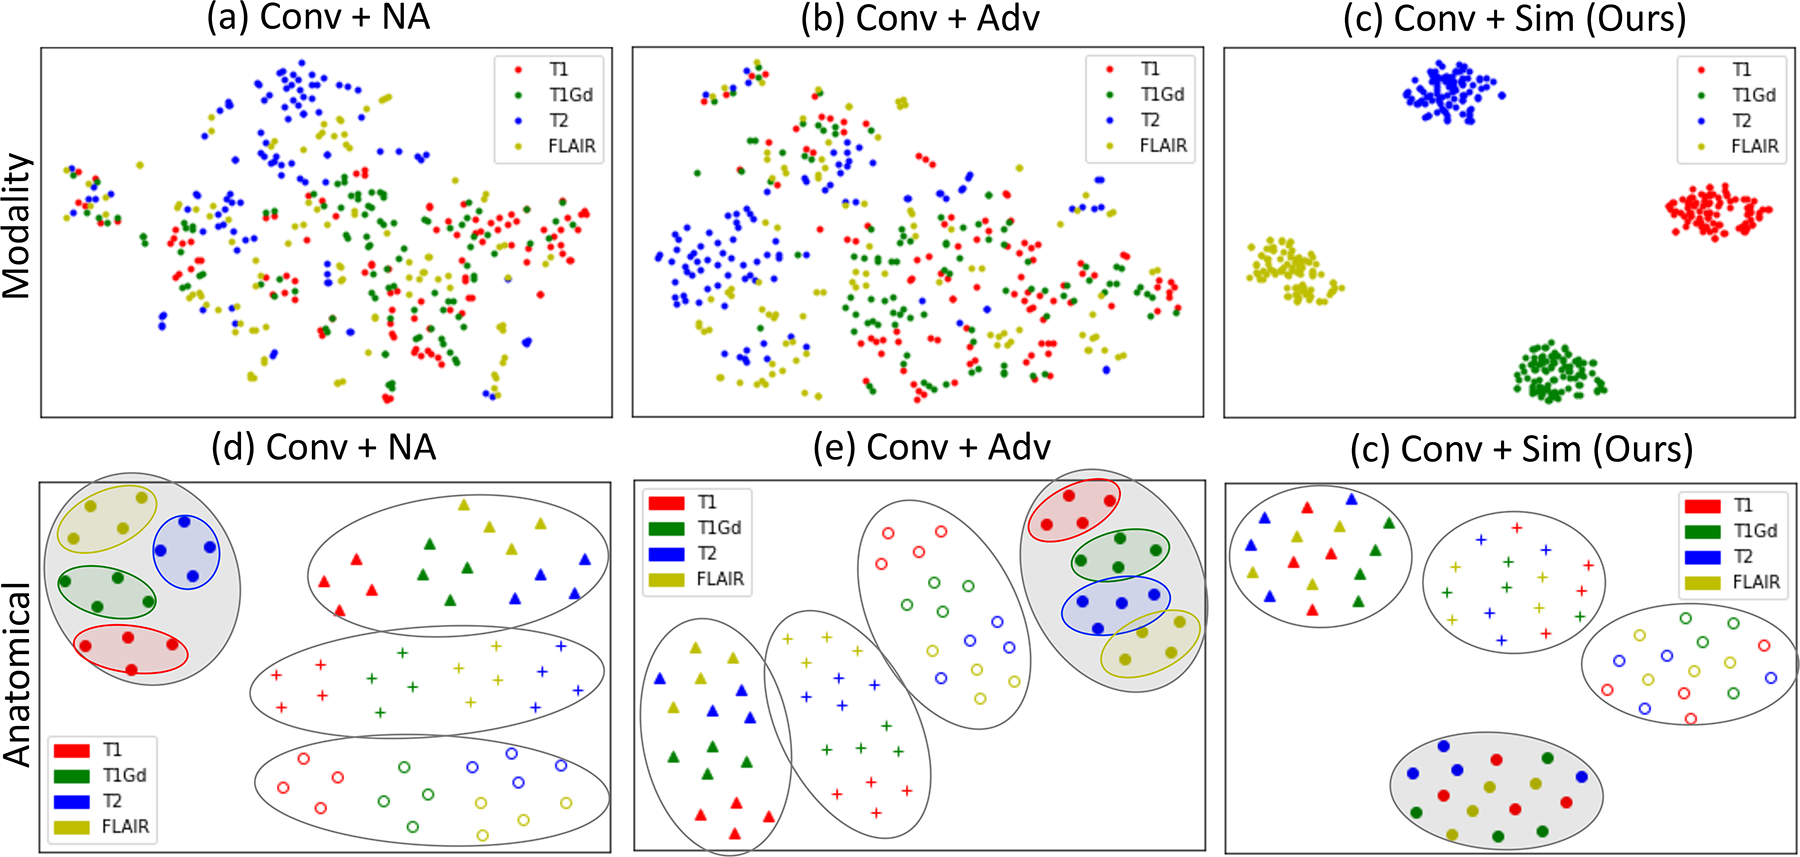
Fig. 3:

t-SNE visualization of the z space (a,b,c) and the s space (d,e,f) for BraTS dataset in 2D spaces. Fully disentangled z should cluster by modality (denoted by color); Fully disentangled s should cluster by subjects (denoted by marker style) with no modality bias (sub-clusters by modality).
