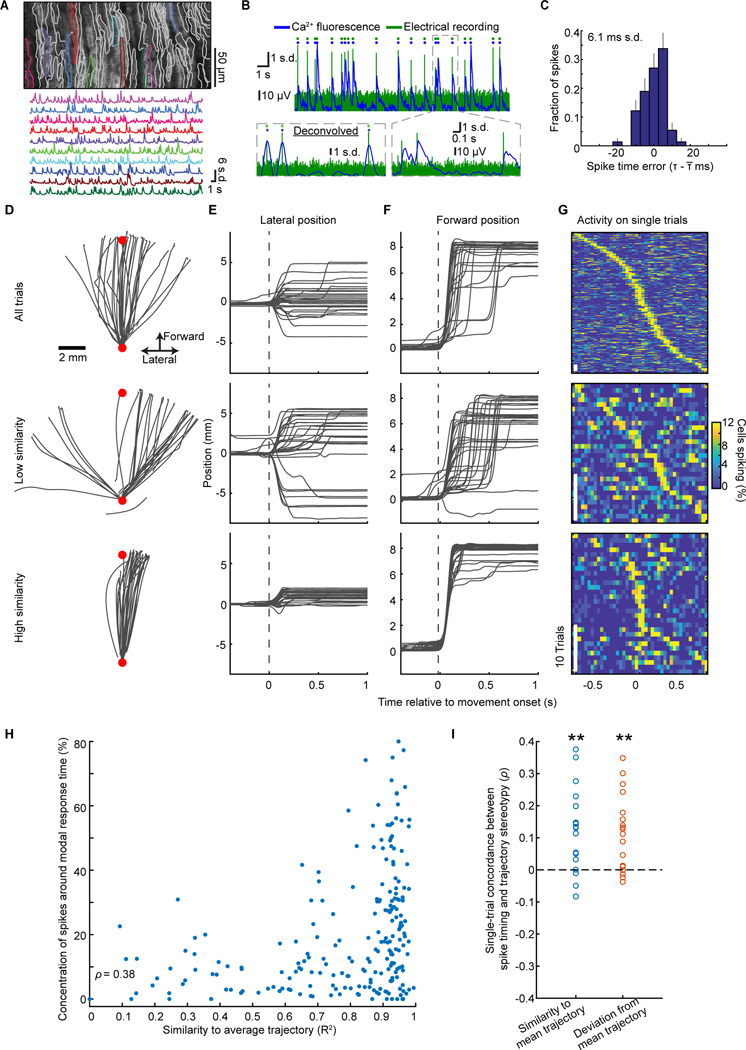
Figure 3. Complex Spike Synchronization Covaries with Movement Stereotypy.
(A) Top, Perimeters of Purkinje cells’ dendritic trees atop a mean two-photon image of cerebellar cortex. Bottom, Ca2+ traces for 10 cells colored in top panel.
(B) Example dual electrical and fast line-scanning Ca2+ recordings. Rasters mark identified spikes. Insets: Magnified views of 3 spikes in raw (right) and deconvolved (left) optical traces.
(C) Histogram of spike timing errors for the cell in B (s.d.:6.1 ms; 152 spikes). Error bars: s.d. estimated based on counting errors.
(D–F) Top, Example reaching trajectories, (D), chosen randomly from one mouse’s trials, and their lateral (E) or forward (F) time-dependence. Middle, bottom panels show 30 trajectories that were most dissimilar (middle) or similar (bottom) to the mean trajectory. Red dots: Start and target locations.
(G) For trials of D–F, each row shows the time-varying synchronized complex spiking on one trial. Stereotyped reaching trials were more likely to have synchronized spiking at motion onset.
(H, I) For the mouse of D–G, we assessed movement stereotypy by scoring trials (individual data points; H) by their similarity (R2) to the mean trajectory (x-axis), and the fraction of cells that spiked at the cell population’s most common response time (y-axis; p<10−6; Spearman’s ρ=0.4; 219 trials). I, Spearman’s ρ, computed as in H for 18 mice (blue points). Using the RMS-deviation from the mean trajectory (orange points) as a stereotypy metric led to nearly the same results (**p=0.002; signed-rank test for non-zero median).
See Figures S3, S4.

