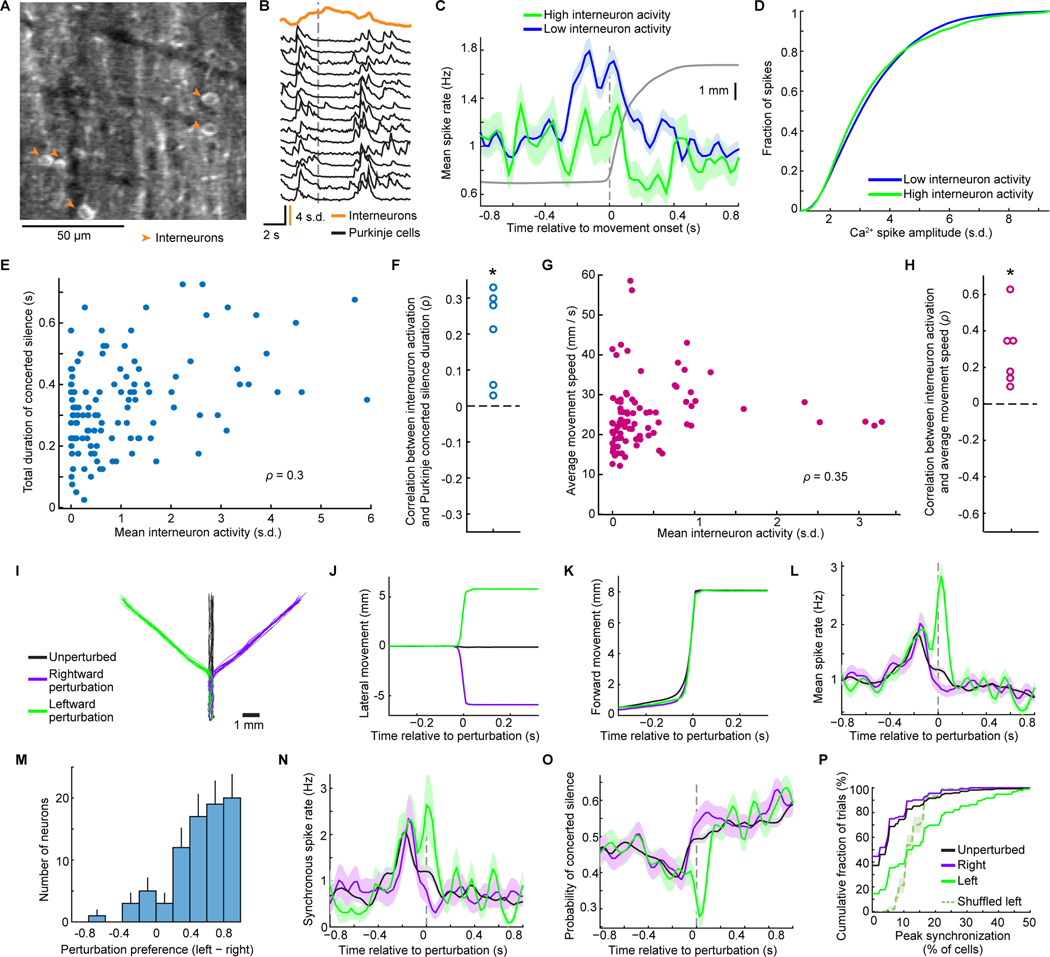
Figure 5. Interneuron Activation Accompanies Concerted Silence in Purkinje Cells and Purkinje Cell Populations Encode Movement Perturbations.
(A) In some mice, GCaMP6f expressed in both Purkinje cells and molecular layer interneurons (marked by arrowheads in a mean two-photon image).
(B) A rise in Ca2+ activity summed across interneurons (15 cells; orange trace) coincided with concerted silence in all 46 visible Purkinje cells in an example mouse (traces shown for 15 cells). Vertical line: onset of forelimb reaching.
(C) Mean rate of complex spiking by Purkinje cells (6 mice) on trials when interneurons were highly or weakly active (105 reaches with interneuron activity >1 s.d. above the mean, 525 reaches with interneuron activity less than the mean within −500 to 500 ms of reach onset; 62 interneurons; 219 Purkinje cells; 1048 trials).
(D) Cumulative distributions of Ca2+ spike amplitudes across trials with high (green) or low (blue) interneuron activity levels.
(E,F) For an example mouse, E, mean interneuron activity on individual reaching trials (points) covaried with the duration of Purkinje cell concerted silence (119 trials, p=0.0009, permutation test for Spearman correlation). F, Results for all 6 mice (*p=0.03 signed-rank test).
(G, H) Movement speed vs. mean interneuron activation on individual trials, G, for the mouse of E (p=0.008), showing that interneuron activation was predictive of faster movements. Results from 6 mice, H, (*p=0.03 signed-rank test).
(I) In the perturbation task, the robot displaced forward-constrained reaches on a random 25% of trials (12.5% each to the left or right). Traces: 20 trajectories of each type.
(J, K) Mean trajectories decomposed into lateral, J, and forward motion, K, for the mouse in I.
(L) After the perturbation, mean spike rates were greater for leftward perturbations (p<10−6comparing the 50 ms after the perturbation for 113 rightward vs. 115 leftward trials; 780 unperturbed trials; 80 cells; 3 mice in L–P; rank-sum test). Dashed vertical line: Occurrence of a 4 mm lateral deviation.
(M) Histogram of individual cells’ perturbation preferences, (Rleft–Rright)/(Rleft+Rright), where R is the cell’s mean spike rate from 0−50 ms after the perturbation. Error bars: s.d. estimated based on counting errors.
(N, O) Trial-averaged rates of synchronized spiking (with ≥20% of visible cells), N, and concerted silence, O. Leftward perturbations induced more synchronized spiking (p<10–6 rank-sum test).
(P) Cumulative distributions of the largest set of cells spiking concurrently 0−50 ms after the perturbation. Trial-shuffled data had less synchrony (p=0.01; permutation test).
Shading in C,J–L,N,O: SEM over trials.

