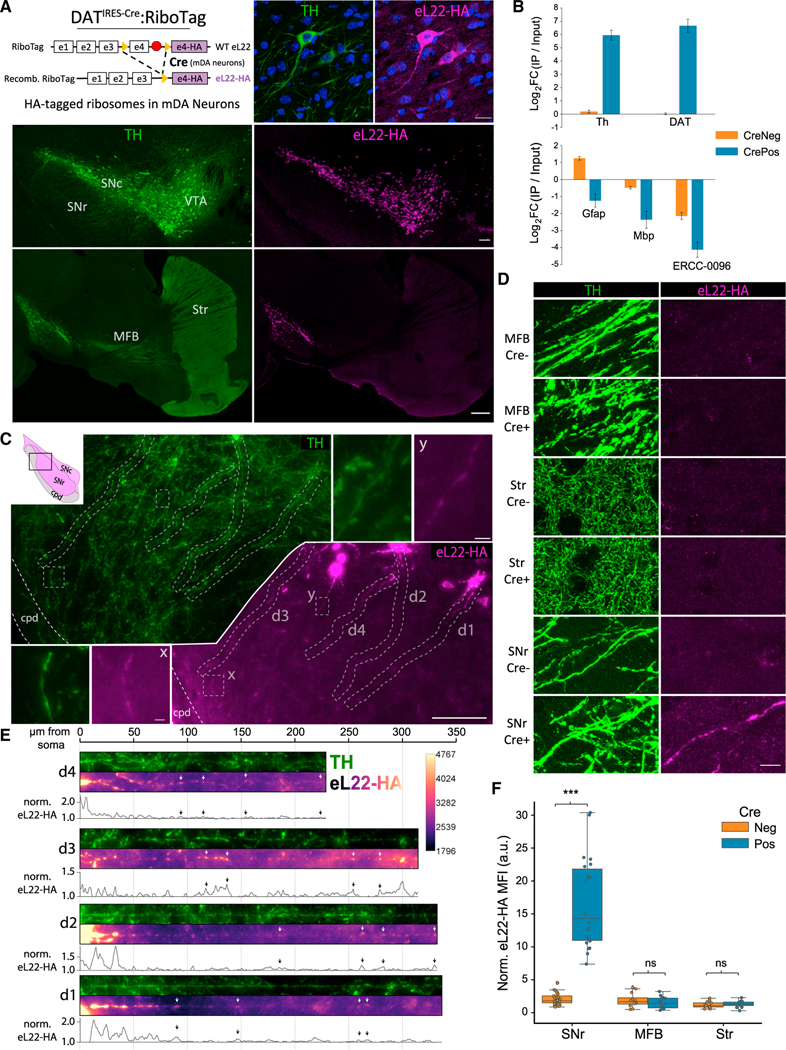
Figure 1. Subcellular distribution of eL22-HA tagged ribosomes in adult (10–14 mo) DATIRES−Cre:RiboTag mice.
(A) DATIRES−Cre:RiboTag genetics (upper left). TH and eL22-HA IF. Upper right: mDA neurons in the SNc, DAPI in blue. Scale bar, 20 μm. Middle: Coronal midbrain section. Scale bar, 100 μm. Lower: Sagittal section. Scale bar, 500 μm.
(B) qRT-PCR from VM Input and RiboTag IPs from DATIRES−Cre:RiboTag mice (Cre+, n = 7) or Cre− littermates (n = 5) showing IP/Input enrichment relative to Actb (mean ΔΔCq +/− SEM).
(C) Ventrolateral SNc and SNr stained for TH and eL22-HA. x, y insets shown in white lines. Dendrites d1-d4 are displayed below in (E). Scale bars, main image, 100 μm; insets, 5 μm. cpd, cerebral peduncle.
(D) TH and eL22-HA staining in the MFB, striatum, and SNr of Cre−/Cre+ RiboTag mice. Scale bar, 10 μm.
(E) Straightened dendritic segments d1-d4 from (C) with eL22-HA intensity normalized to local background and plotted below. Arrows indicate eL22-HA hotspots.
(F) Quantification of eL22-HA signal within TH+ neurites in the MFB (axons), striatum (axons), and SNr (dendrites) of Cre− and Cre+ mice. Data are background-normalized mean eL22-HA intensity of TH+ pixels within a field of the indicated region (n = 6–10 fields, n = 4 sections, n = 3 mice per each genotype/region). Two-way ANOVA main effects: Region, F = 74.4 (2, 100), p = 1.6−20; genotype, F = 117.2 (1, 100), p = 1.5 3 10−18; and region:fenotype interaction, F = 68.4 (2,100), p = 1.9 3 10−19. Tukey’s HSD post hoc test for Cre+ versus Cre− staining: SNr (p-adj < 0.001), MFB and Str (both p-adj > 0.9). ***p-adj < 0.001.

