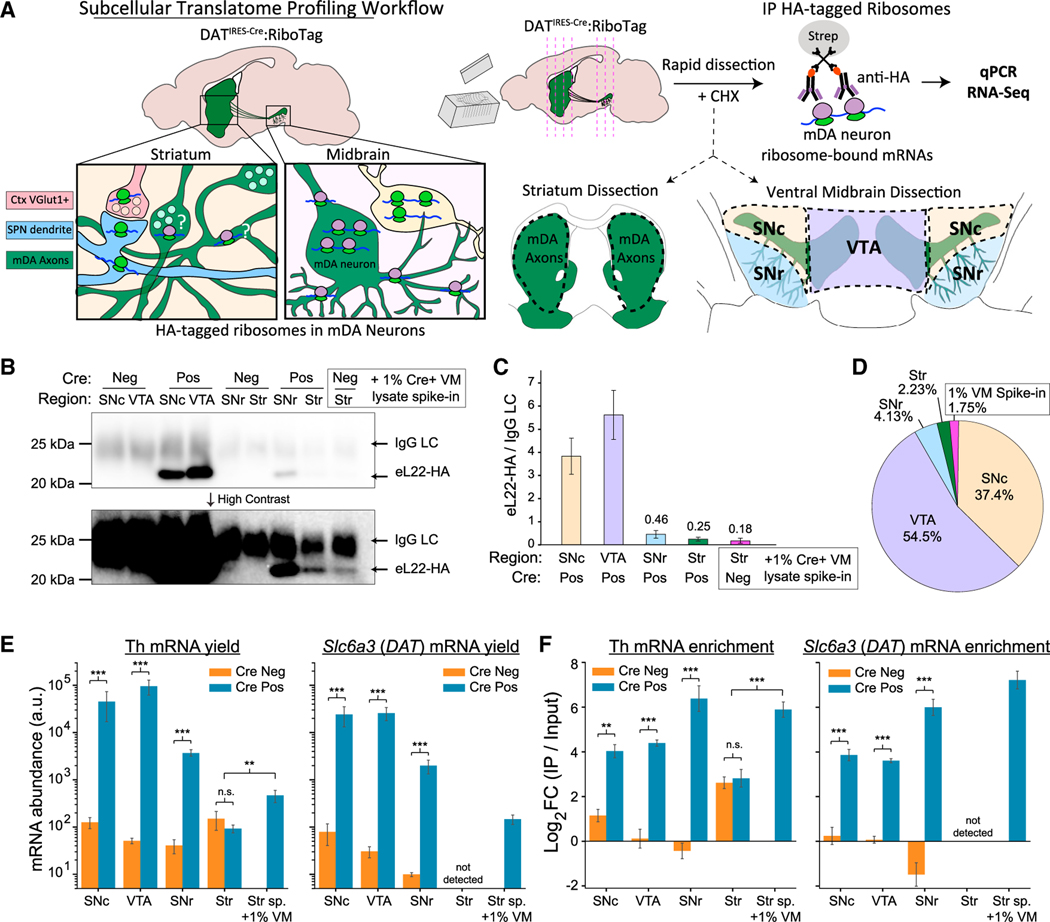
Figure 2. Regional distribution of eL22-HA protein and dopaminergic mRNAs captured by RiboTag IP in adult mice (10–14 mo).
(A) Subcellular translatome profiling workflow.
(B) Western blot of captured eL22-HA from RiboTag IPs. eL22-HA (23 kDa) is detected below IgG light chain (LC, approximately 25 kDa). Lower: High contrast reveals bands in striatal samples and 1% VM spike-in.
(C) Quantification of Western blot eL22-HA, normalized to IgG LC with mean ± SEM shown for each region/genotype (n = 3–4).
(D) Fractional abundance of eL22-HA captured in each region, using normalized eL22-HA intensity from (C).
(E and F) qRT-PCR of Th and Slc6a3/DAT mRNA in RiboTag IPs from each region/genotype (n = 3–4 each). (E) mRNA abundance in arbitrary units (240–Cq). Mean (A)u. +/− SEM are plotted. For Th mRNA, two-way ANOVA main effects: region, F = 17.7 (3, 19), p = 9.8 3 10−6; genotype, F = 168.1 (1, 19), p = 6.9 3 10−11; and region:genotype interaction, F = 20.1 (3, 19), p = 4.0 3 10−6. Tukey’s HSD post hoc for Cre+ versus Cre− samples: ***p-adj<0.001 for SNc, VTA, and SNr, but not for Striatum (p-adj > 0.9). Welch’s t test for 1%VM/Str_Sp samples versus Cre+/Cre− striatal samples: t(9) = 3.72, p = 0.0062. For DAT mRNA, two-way ANOVA main effects: region, F = 13.0 (2, 15), p = 5.3 3 10−4; genotype, F = 262.5 (1, 15), p = 6.5 3 10−11; and region:genotype interaction, F = 1.46 (2, 15), p = 0.26. DAT mRNA was not detected in striatal samples. Tukey’s HSD post hoc test for Cre+ versus Cre− samples: p-adj < 0.001 for the SNc, VTA, and SNr (***). (F) qRT-PCR for RiboTag IP/Input enrichment relative to Actb (mean ΔΔCq +/− SEM). For Th mRNA, two-way ANOVA main effects: genotype, F = 154.5 (1, 20), p = 7.3 3 10−11; region, F = 1.97 (3, 20), p = 0.15; and region:genotype interaction, F = 23.4 (3, 20), p = 9.4 3 10−7. Tukey’s HSD post hoc test for Cre+ versus Cre− samples: p-adj < 0.01 for SNc, VTA, and SNr, but not for striatum (p-adj > 0.9). Welch’s t test for 1%VM/Str_Sp samples versus Cre+/Cre− striatal samples: t(10) = 6.66, p = 0.0009. For Slc6a3/DAT mRNA, two-way ANOVA main effects: genotype, F = 269.2 (1, 15), p = 5.4 3 10−11; region, F = 1.96 (3, 15), p = 0.18; and region:genotype interaction, F = 19.1 (2, 15), p = 7.5 3 10−5. Tukey’s HSD post hoc test for Cre+ versus Cre− samples: p-adj < 0.001 for SNc, VTA, and SNr (**p-adj < 0.01, ***p-adj < 0.001).

