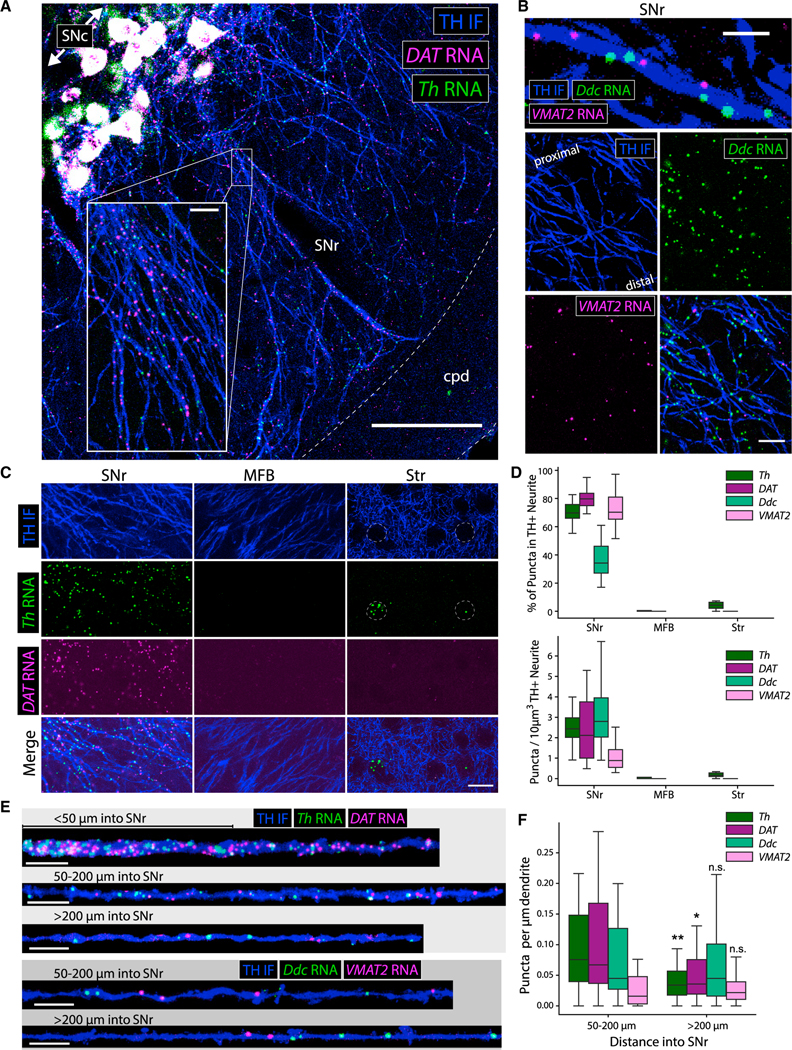
Figure 4. FISH reveals dendritic, but not axonal, localization of dopaminergic mRNAs in adult (10–14 mo) mouse brain.
(A) TH IF and FISH for Th and Slc6a3/DAT mRNA in the SN, cpd: cerebral peduncle. Scale bar, 100 μm; inset scale bar, 10 μm.
(B) TH IF and FISH for Ddc and Slc18a2/VMAT2 mRNA in the SNr. Scale bars, 5 μm (upper), 15 μm (lower).
(C) TH IF and FISH for Th and Slc6a3/DAT mRNA. Scale bar, 15 μm.
(D) Quantification of RNA puncta within TH+ neurites from each region in (C): n = 8–21 fields from 5–6 sections, 5–6 mice.
(E) TH+ dendrite segments and mRNAs at various distances into the SNr. Scale bars, 10 μm.
(F) Quantification of RNA puncta within TH+ dendrites from (E). Box and whiskers plots represent puncta per μm for each segmented dendrite in each region: (50–200μm, Th) n = 31–38 dendrites from 5–6 sections, 5–6 mice. *p < 0.05, **p < 0.01 for Mann-Whitney U test comparing >200 μm with 50–200 μm for each RNA.

