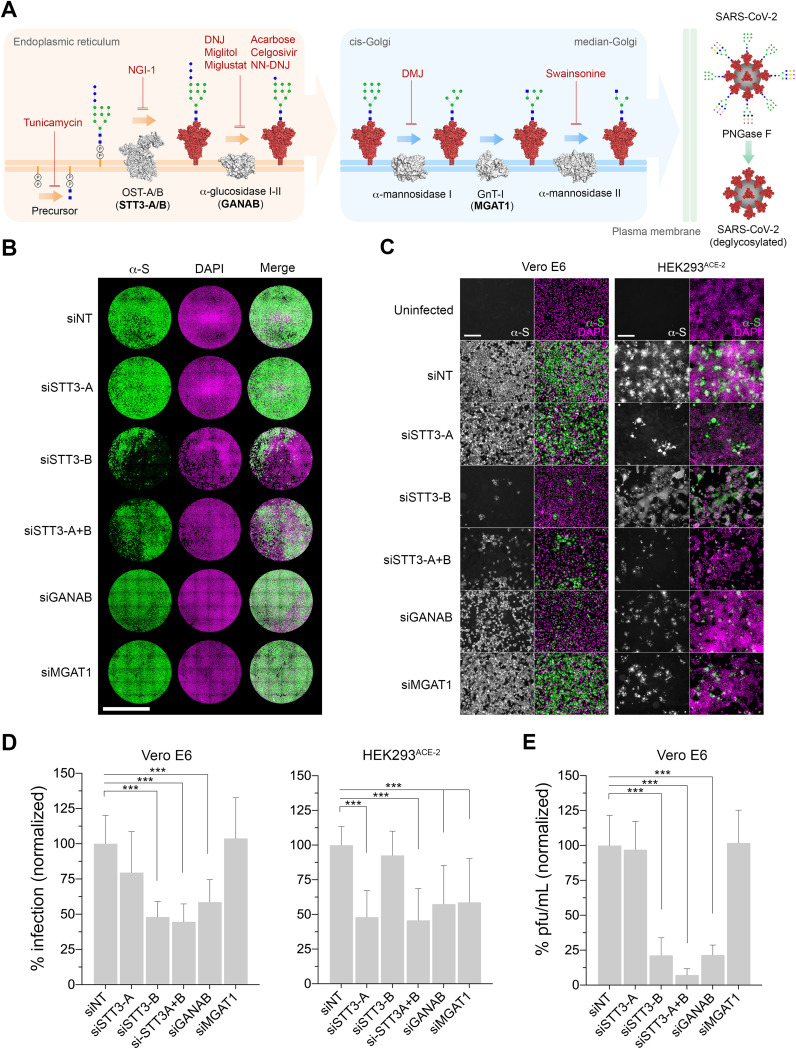
FIG 1.
Genetic ablation of host N-glycosylation reduces SARS-CoV-2 infection. (A) Schematic of the key steps in the N-glycosylation pathway targeted in this study. The precursor N-glycan is first synthesized in the ER and transferred to the SARS-CoV-2 spike protein (red) by the OST’s catalytic subunit, STT3 (isoforms A and B). The N-glycans are further processed by the α-glucosidases I and II (GANAB catalytic subunit) before the glycoprotein is exported to the Golgi apparatus, where the glycans are modified by the α-mannosidase I, GnT-I (MGAT1), and α-mannosidase II. Mature glycosylated virions egress to the extracellular space, where they can be artificially deglycosylated using PNGase F. Glycosylation enzymes, gray; glycosylation inhibitors, red text; glycosylation enzymes targeted by siRNA, boldface text. N-glycans are represented using CFG nomenclature. Blue square, N-acetylglucosamine; green circle, mannose; blue circle, glucose; yellow circle, galactose; magenta diamond, sialic acid; virion N-glycan structures are representative only. (B) Representative whole-well scans of confluent Vero E6 monolayers transfected either with siNT (nontargeting control) or siRNAs targeting STT3-A, STT3-B, STT3A+B, GANAB, and MGAT1 and infected with SARS-CoV-2 (MOI of 0.05, 24 h). Cells immunostained using anti-spike antibodies (green), counterstained with DAPI DNA staining (magenta), and merged. Scale bar, 5 mm. (C) Representative images of Vero E6 and HEK293ACE-2 siRNA cells infected with SARS-CoV-2 (MOI of 0.05 for 24 h, Vero; MOI of 0.1 for 24 h, HEK293). Anti-spike, gray; merge, green; with DAPI, magenta. Scale bars, 200 μm. (D) Percentage of Vero E6 and HEK293ACE-2 infected cells (anti-spike positive) in panel A, normalized to siNT. Three technical replicates and four and three biological replicates were done for Vero and HEK cells, respectively. (E) Infectious viral particles (PFU/mL) in supernatants from infected Vero E6 siRNA cells in panel A, normalized to siNT. Bars indicate mean values, error bars represent ± standard deviations (SD), and asterisks indicate significance (P < 0.001).

