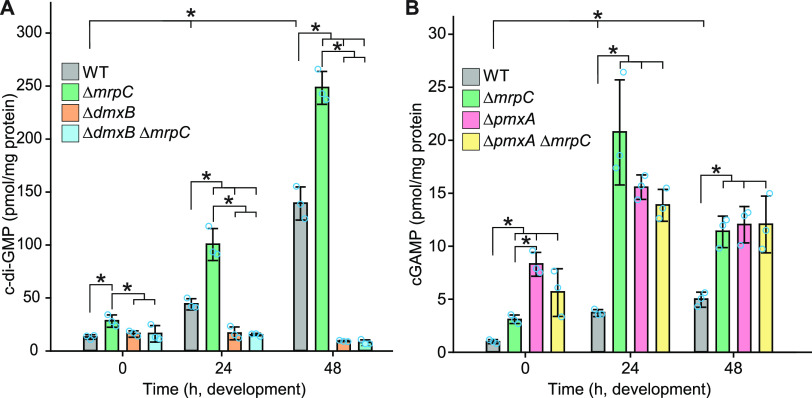
FIG 5.
c-di-GMP and cGAMP accumulation during growth and development. (A and B) Cells were harvested at the indicated time points of development, and nucleotide levels and protein concentrations were determined. Levels are shown as mean ± SD calculated from three biological replicates. Individual data points are in light blue. *, P < 0.05; in Student’s t test. At each specific time point, only pairwise comparisons with significant differences are indicated.

