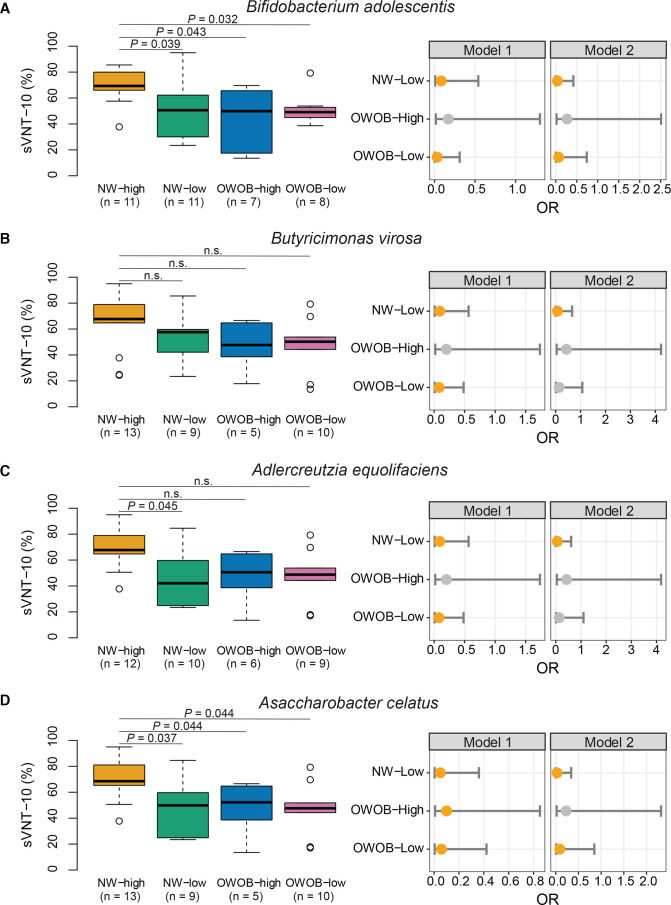
Figure 4.
Weight status modifies the assocaitions between baseline gut bacterial species and immune response in CoronaVac vaccinees at 1 month after second dose of vaccination. Immune response and ORs to be high responders separated by baseline bacterial abundance within weight strata (A) by Bifidobacterium adolescentis abundance. (B) By Butyricimonas virosa abundance (C) by Adlercreutzia equolifaciens abundance. (D) by Asaccharobacter celatus abundance. sVNT-10: sVNT of 10-fold diluted plasma. Sample size per group was indicated on the figure. Comparisons between subgroups were done using Dunn’s test (one sided) with FDR correction. Model 1: crude model. Model 2: adjusted for age. Reference group: NW with high bacterial abundance. Elements on boxplots: centre line, median; box limits, upper and lower quartiles; whiskers, 1.5×IQR; points, outliers. Each OR was presented as an orange dot with a bar showing the 95% CI. NW, normal weight; FDR, false discovery rate; OWOB, overweight or obese; sVNT, surrogate virus neutralisation test.

