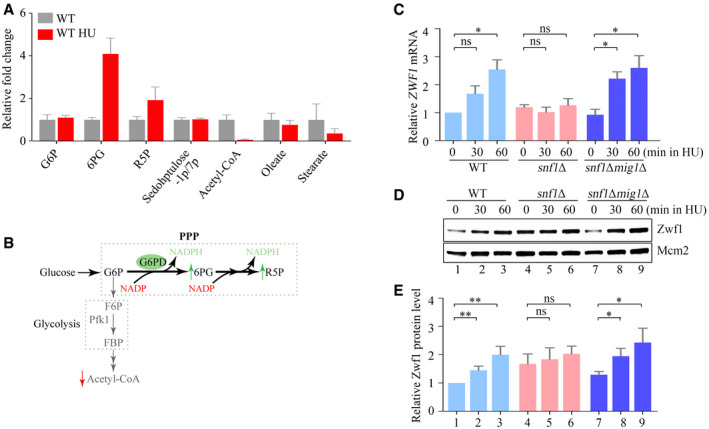
Figure 1. Replication stress induces the pentose phosphate pathway through Snf1 and Mig1.

-
AThe relative fold change of carbon metabolites with or without HU treatment for 60 min. Error bars represent standard deviations (SD) from six independent experiments.
-
BThe diagram of carbon metabolism rewiring focused on glycolysis and PPP (pentose phosphate pathway).
-
CThe relative ZWF1 mRNA levels were measured by qPCR. Cells were grown into an exponential phase and treated by 200 mM HU for 0, 30, and 60 min. mRNA were prepared just as described in Methods and Materials. The relative mRNA levels of ZWF1 to ACTIN1 were determined by qPCR analyses. The value of the untreated WT sample was normalized to 1. Error bars represent standard deviations (SD) from at least three biological repeats. Statistical significance was evaluated based on Student’s t‐test (*0.01 < P‐values < 0.05).
-
D, EThe relative levels of endogenous Zwf1 protein with a GFP tag were analyzed by immunoblots in WT, snf1Δ, or snf1Δmig1Δ cells (D). Protein extracts were probed with an anti‐GFP antibody. Mcm2 was applied as a loading control. Three independent experiments were carried out and the relative fold changes were measured by Image J (E). Error bars represent standard deviations (SD) from three biological repeats. Statistical significance was evaluated based on Student’s t‐test (*0.01 < P‐values < 0.05; **0.001 < P‐values <0.01).
Source data are available online for this figure.
