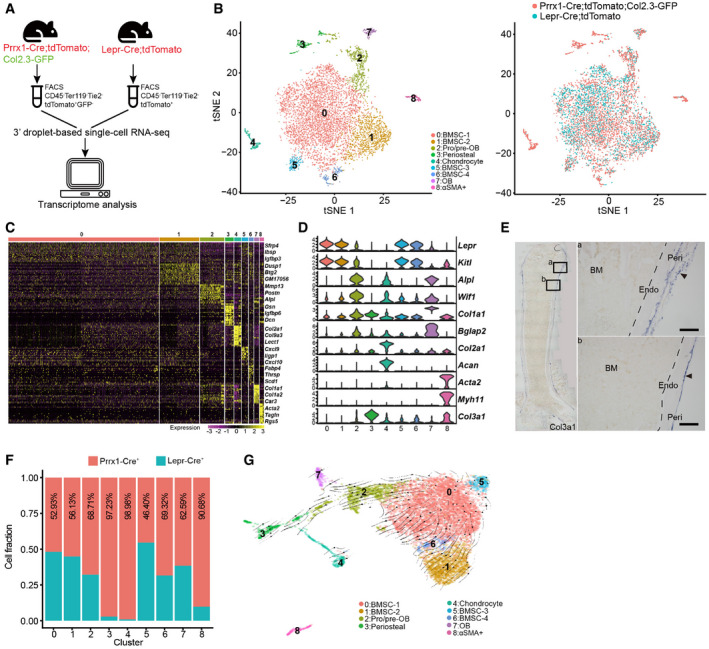
Schematic overview of the scRNA‐seq workflow.
t‐SNE plots showing integrated analysis of Prrx1‐Cre‐ (8‐week‐old mice, n = 3 males) and Lepr‐Cre‐traced (8‐week‐old mice, n = 4 males) cells. Cells were colored by clusters (left) or samples (right). Top 20 PCs were chosen for the clustering.
Heatmap showing the relative expression levels (row‐wide Z score) of the 20 most significant markers for each cluster (rows) across cells in the 9 clusters (columns). Bars on the top were colored as in (B).
Violin plots showing the expression of feature genes for each cluster.
In situ hybridization of Col3a1 on femur sections. Col3a1 was expressed in the perichondral (a) and periosteal (b) regions, but not in the bone marrow. B: Bone; BM: Bone marrow; Peri: Periosteum; Endo: Endosteum. Scale bars are 100 µm. Arrowheads indicated the periosteum.
Relative contribution to each cluster by Prrx1‐Cre‐ and Lepr‐Cre‐traced cells after normalization to total cells (4,170 cells in Prrx1‐Cre, 3,050 cells in Lepr‐Cre).
UMAP plot showing the inferred trajectories by RNA velocity analysis.

