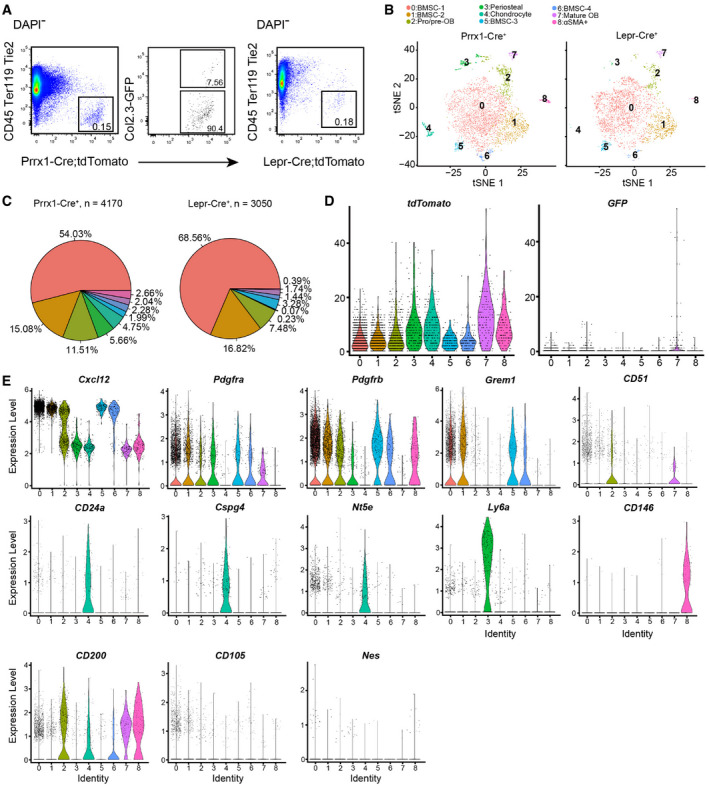
Figure EV1. Further characterizations of Prrx1‐Cre‐ and Lepr‐Cre‐traced cells.

- Flow cytometry gating strategy for Prrx1‐Cre; tdTomato; Col2.3‐GFP and Lepr‐Cre; tdTomato mice.
- t‐SNE plots showing cells sorted from Prrx1‐Cre; tdTomato; Col2.3‐GFP (left) and Lepr‐Cre; tdTomato mice (right). Cells were colored by clustering.
- Pie graphs showing the cell frequency distribution. Colored as in (B).
- Violin plots showing the expression levels of tdTomato (left) and GFP (right) transcripts. Clusters are colored as in (B).
- Violin plots showing the expression levels of skeletal stem and progenitor cell markers in each cluster (colored as in B).
