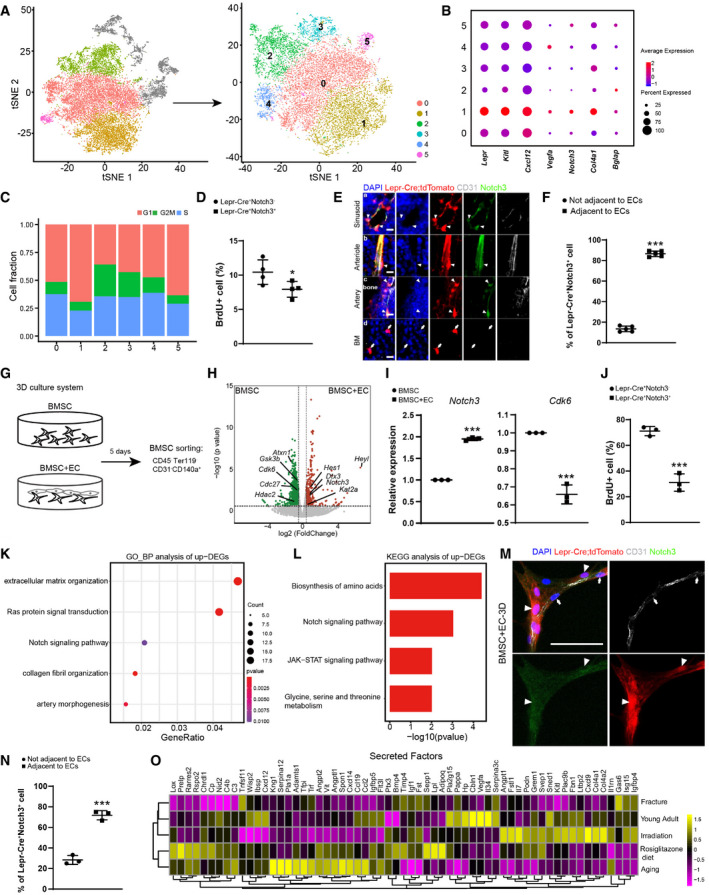
Figure 3. Identification of a Notch3+ sub‐population within the adipogenic lineage cells.

-
At‐SNE plots showing the original (left) and re‐clustered (right) adipogenic lineage cells by integrated analysis of homeostatic and stress conditions. Top 15 PCs were chosen for the clustering.
-
BDot plots showing the gene expression patterns of selected genes in each cluster.
-
CStacked bar charts showing the cell cycle status in all clusters.
-
DFlow cytometry analysis of BrdU incorporation in uncultured Lepr‐Cre+Notch3+/− BMSCs (n = 4 independent experiments). Eight‐week‐old Lepr‐Cre; tdTomato mice were given a single intraperitoneal injection of BrdU (100 mg/kg body mass) and maintained on 0.5 mg/ml of BrdU in the drinking water for 14 days.
-
EImmunofluorescent images of the distal femur in 8‐week‐old Lepr‐Cre; tdTomato mice. Notch3 (green), tdTomato (red), CD31 (gray), DAPI (blue). Sinusoid (a), arteriole (b), artery (c), and avascular bone marrow (BM, d) regions are shown. Arrowheads indicated Notch3+ tdTomato+ adventitial cells closely associated with ECs. Arrows indicated Notch3− tdTomato+ reticular cells in the bone marrow that were not associated with ECs. Scale bars are 10 µm.
-
FLocalization quantification of Lepr‐Cre+Notch3+ cells relative to bone marrow ECs (n = 5 biological replicates from three independent experiments). Cells within 5 µm diameter of ECs were considered adjacent.
-
GGraphical illustration of the 3D co‐culture system.
-
HVolcano plot showing DEGs in the bulk RNA‐seq analysis (n = 3 biological replicates). Green dots represent down‐regulated genes. Red dots represent up‐regulated genes.
-
IqPCR analysis of Notch3 and Cdk6 expression (n = 3 independent experiments).
-
JFlow cytometry analysis of BrdU incorporation in Lepr‐Cre+Notch3+/− BMSCs after 3D co‐cultured with bone marrow ECs (n = 3 independent experiments). BrdU was administered at a final concentration of 10 µM from culture day 1 to day 5.
-
K, LGO terms (K) and KEGG pathways (L) enriched in up‐regulated genes.
-
MRepresentative confocal images of BMSCs 3D co‐cultured with bone marrow ECs. Z‐stack projection is shown. Notch3 (green), tdTomato (red), CD31 (gray), DAPI (blue). Arrowheads indicated Notch3+tdTomato+ adventitial cells. Arrows indicated bone marrow ECs. Scale bar is 50 µm.
-
NLocalization quantification of Lepr‐Cre+Notch3+ cells relative to bone marrow ECs after 3D co‐culture (n = 3 biological replicates from three independent experiments). Cells within 25 µm diameter of ECs were considered adjacent.
-
OHeatmap showing the average expression levels (column‐wide Z score) of secreted factors with clustering.
Data information: All data represented Mean ± SD. The statistical significance of differences was analyzed by two‐tailed unpaired Student’s t‐test. *P < 0.05, ***P < 0.001.
