-
A
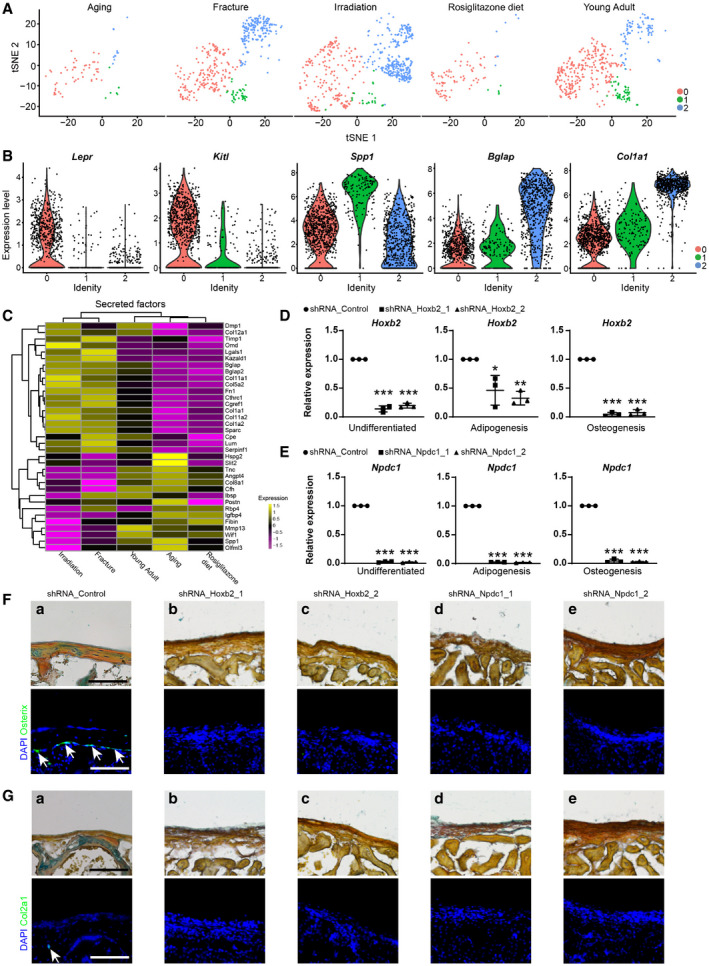
t‐SNE plots showing osteogenic sub‐clusters split by conditions. Colored as in Fig
4A.
-
B
Violin plots showing the expression levels of selected marker genes in each sub‐cluster.
-
C
Heatmap showing the secreted factors enriched in osteogenic clusters under homeostatic and stress conditions with clustering. Z‐score (row scaling) was calculated.
-
D, E
qPCR analysis of Hoxb2 (D) and Npdc1 (E) knockdown efficiency in BMSC before and after adipogenic or osteogenic differentiation (n = 3 independent experiments). The statistical significance of differences was analyzed by two‐tailed unpaired Student’s t test. Data represented Mean ± SD. *P < 0.05, **P < 0.01, ***P < 0.001.
-
F
Representative renal sub‐capsular transplantation images. Movat’s pentachrome (upper panels) and immunostaining of Osterix (Sp7, lower panels) were performed to analyze bone ossicles 4 weeks after transplantation of control (a), Hoxb2‐ (b and c) or Npdc1‐deficient (d and e) BMSCs. Yellow stain: bone matrix and fibrotic tissue; Blue stain: cartilage matrix. Arrows indicated Osterix+ osteolineage cells. DAPI indicated the nucleus. Scale bars are 50 μm.
-
G
Representative renal sub‐capsular transplantation images. Movat’s pentachrome (upper panels) and immunostaining of Col2a1 (lower panels) were performed to analyze bone ossicles 4 weeks after transplantation of control (a), Hoxb2‐ (b and c) or Npdc1‐deficient (d and e) BMSCs. Yellow stain: bone matrix and fibrotic tissue; Blue stain: cartilage matrix. Arrow indicated Col2a1+ chondrocyte. DAPI indicated the nucleus. Scale bars are 50 μm.

