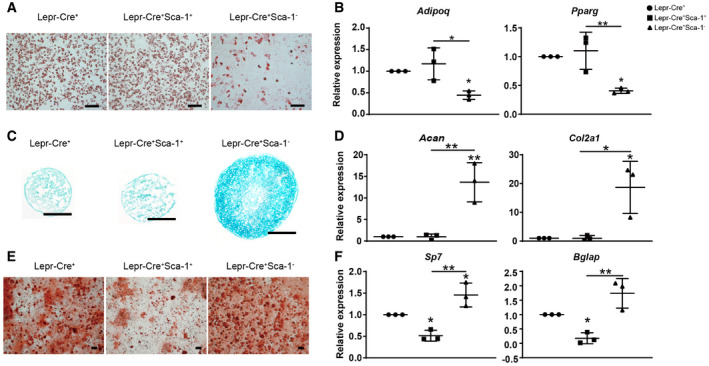
Figure 6. Functional analysis of the Sca‐1+ sub‐population in the periosteum.

-
A, BRepresentative oil red staining after 7 days of adipogenic differentiation in Lepr‐Cre+ subsets (A) and qPCR analysis of Adipoq and Pparg expression (B) (n = 3 independent experiments). Scale bars are 100 µm.
-
C, DIn vitro chondrogenic differentiation of sorted periosteal cells. Representative alcian blue staining after chondrogenic differentiation for 21 days and cryosection (C). Scale bars are 100 µm. Chondrogenic efficiencies were quantified by qPCR analysis of Acan and Col2a1 expression (D) (n = 3 independent experiments).
-
E, FIn vitro osteogenic differentiation of sorted periosteal cells. Representative alizarin red staining after osteogenic differentiation for 14 days. Scale bars are 200 µm. Osteogenic efficiencies were quantified by qPCR analysis of Sp7 and Bglap expression (F) (n = 3 independent experiments).
Data information: The statistical significance of differences was analyzed by one‐way ANOVAs with Tukey’s multiple comparison tests. All data represented Mean ± SD. *P < 0.05, **P < 0.01.
