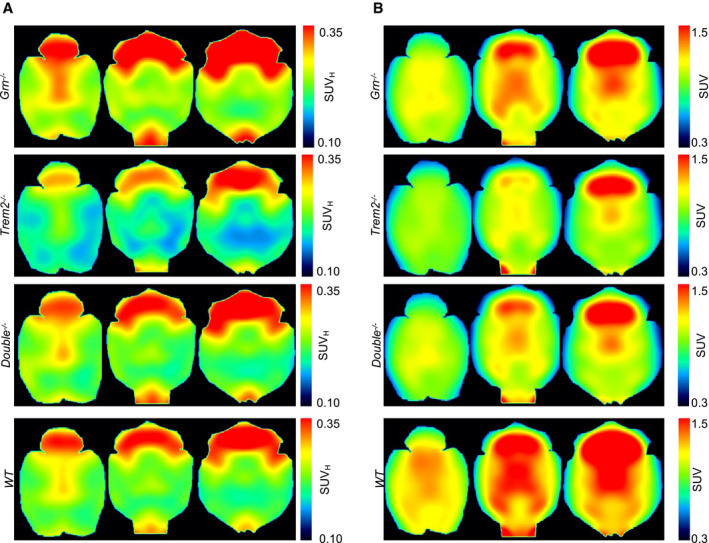
Group‐averaged axial slices of TSPO‐PET (SUV
H scaling) and FDG‐PET (SUV scaling) show microglia activity and glucose metabolism in comparison of
Grn
−/−,
Trem2
−/−,
Double
−/−, and WT‐type mice. Images represent the raw PET data used for calculation of %‐differences in Figs
1A and
9E.
TSPO‐PET images depict increased microglial activity in Grn
−/− mice, reduced microglial activity in Trem2
−/− mice, and similar levels of microglial activity in Double
−/− and WT mice.
FDG‐PET images indicate similar reduction in glucose uptake in Grn
−/−, Trem2
−/−, and Double
−/− in comparison to WT mice.

