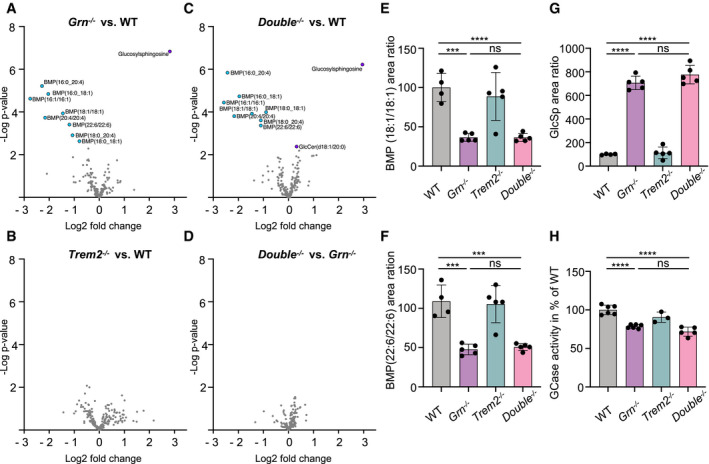
Figure 7. Reduced TREM2 signaling does not rescue dysregulated lipids in Grn −/− mice.

-
A–DVolcano plot presentation of lipids and metabolites upregulated (purple) or downregulated (blue) in total brain homogenates from 6‐month‐old male Grn −/− (A, n = 5), Trem2 −/− (B, n = 5), and Double −/− (C, n = 5) mice in comparison to WT (n = 4), and Double −/− in comparison to Grn −/− mice (D). Counts for each sample were normalized to the mean value of WT followed by a log2 transformation (n = 4–5 per genotype). Analyte values were adjusted with an FDR < 10% to exclude type I errors in null hypothesis testing.
-
E–GAbundance of BMP species and glucosylsphingosine (GlcSph) in total brain of 6‐month‐old Grn −/−, Trem2 −/−, Double −/−, and WT mice (n = 4–5 per genotype).
-
HGlucocerebrosidase (GCase) activity in whole‐brain lysates from 6‐month‐old male Grn −/−, Trem2 −/−, Double −/−, and WT mice. The linear increase in fluorescence signal was measured and then normalized to WT mice (n = 3–6 per genotype).
Data information: Data represent mean ± SEM. For statistical analysis, one‐way ANOVA with Tukey’s post hoc test of Grn −/−, Trem2 −/−, and Double −/− was used. Statistical significance was set at ***P < 0.001; ****P < 0.0001, and ns, not significant.
Source data are available online for this figure.
