Figure 3.
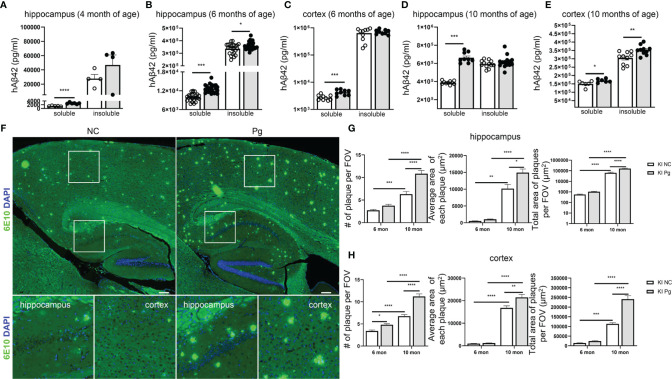
Pg infection accelerates Aβ production and plaque formation in App KI mice. (A–E) Levels of soluble and insoluble hAβ42 in the brains of control and Pg-infected App KI mice at 4, 6 and 10 months of age. A, n=4-6/group; B, n=24/group; C-E, n=6-10/group. Samples were run in duplicate in ELISA. (F) Representative micrographs showing Aβ plaques formation in App KI mice at 10 months of age. Whole brain images were stitched with 30 series micrographs captured at 10 x objective using a KEYENCE BZ-800 microscope. Boxed areas were further enlarged. Aβ plaques were labeled with 6E10 (green) and cell nuclei were labeled with DAPI (blue). (G, H) Quantification of the number of Aβ plaques, average plaque size, and total plaque-occupied area per field of view (FOV) in the hippocampus (G) and cortex (H) of App KI mice at 6 and 10 months of age. Five representative regions of the cortex and hippocampus were captured at 40x objective from each brain section and quantified (n=5-7/group). Data are expressed as mean ± SEM. *P < 0.05, **P < 0.01, ***P < 0.001, ****P < 0.0001 by unpaired Student t-test (A–E), or by two-way ANOVA followed with Tukey correction (G, H).

