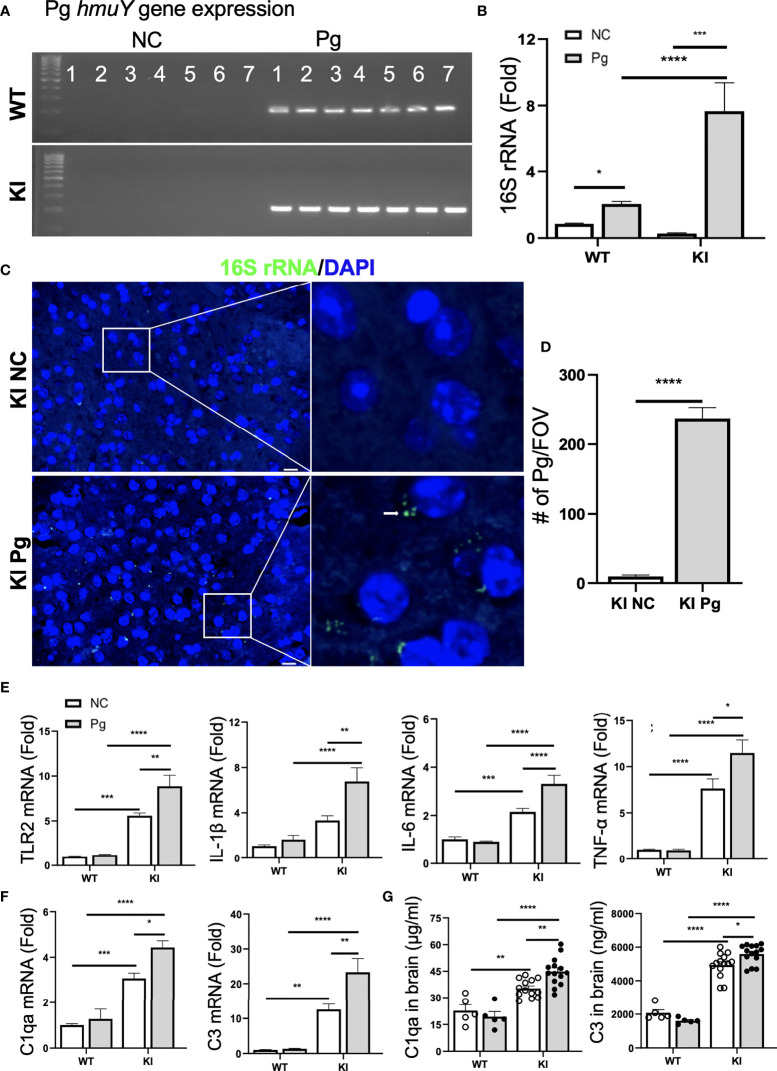
Figure 4.
Pg invades the brain and induces neuroinflammation and complement activation. (A) Pg-specific hmuY gene expression in brains from WT and App KI mice. (B) Pg-specific 16S rRNA expression in brains from WT and App KI mice. The levels of gene expression were normalized to GAPDH and shown as fold changes. Samples were run in duplicates (n=7/group). (C) Representative micrographs depicting intracellular localization of Pg in the cortex of brains from App KI mice. Pg were probed with 16S rRNA with FITC (green, arrowhead) and nuclei were labeled with DAPI (blue). Boxed areas were further enlarged. Scale bar, 10 µm. (D) Quantification of Pg in brain sections from non-infected and Pg-infected App KI mice. Five representative regions were captured at 40 x objective from each brain section and quantified (n=5-7/group); FOV, field of view. (E) The relative gene expression of inflammatory cytokines and TLR2 in brain tissues from WT and App KI mice. Samples were done in duplicates (n=5-7/group). (F) The relative gene expression of C1qa and C3 in brain tissues from WT and App KI mice. Samples were run in duplicates (n=5-7/group). (G) The levels of C1qa and C3 in the brains of WT and App KI mice. Samples were run in duplicates (WT mice, n=5-7/group; App KI mice, n=10-12/group). Data are expressed as mean ± SEM; *P < 0.05, **P < 0.01, ***P < 0.001, ****P < 0.0001 by two-way ANOVA followed with Tukey correction (B, E–G) or by unpaired Student t-test (D).

