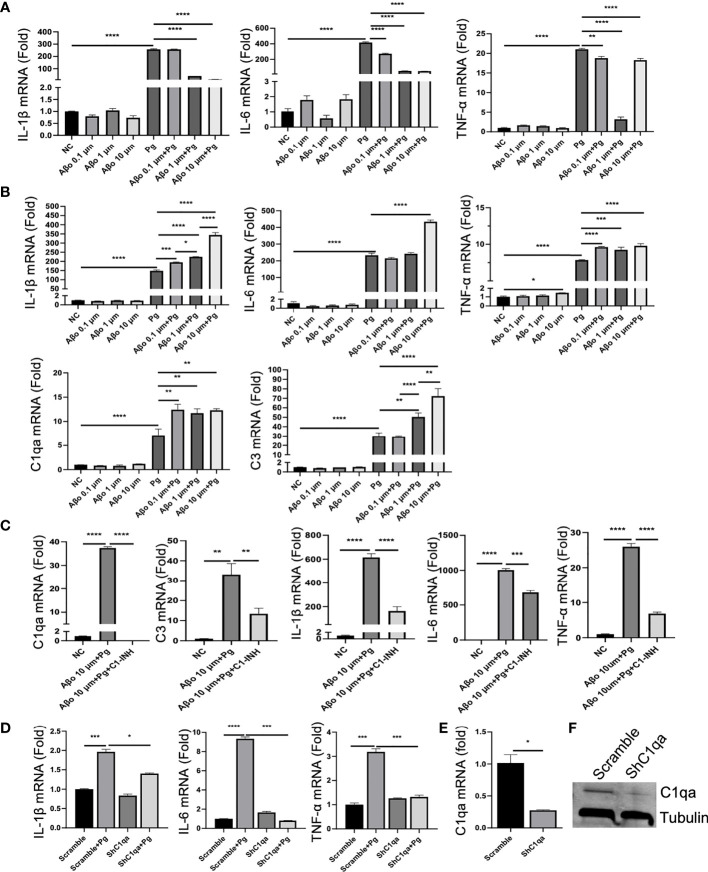
Figure 6.
Effect of Aβo and complement activation on Pg-induced microglial inflammatory responses. (A, B) Aβo on Pg-induced cytokine production and complement activation. Primary microglia were treated with Aβo (0.1, 1 or 10 µM), Pg (MOI=50), or co-stimulated with Aβo and Pg for 24 h (A), or pretreated with Aβo for 6 h followed by Pg stimulation for 24 h (B). Relative gene expression of IL-1β, IL-6, TNF-α, C1qa, and C3 was analyzed by RT-qPCR. (C) C1 inhibition on Pg-induced inflammatory gene expression by microglia. Primary microglia were untreated or pretreated with C1-INH for 4 h, and then treated with Aβo (10 µM) for 6 h followed by Pg (MOI=50) for 24 h. Relative gene expression of C1qa, C3, IL-1β, IL-6, and TNF-α in microglia were analyzed by RT-PCR. (D) Effect of C1qa depletion on Pg-induced cytokine gene expression by microglia. Primary microglia cells expressing scramble or C1qa shRNA vectors were treated with Pg (MOI=50) for 24 h. Relative gene expression of IL-1β, IL-6, TNF-α in microglia were analyzed by RT-PCR. Expression of C1qa mRNA (E) and protein (F) in primary microglia verified by RT-PCR and Western blot. Samples were run in duplicates. Data are expressed as mean ± SEM of three independent experiments; *P < 0.05, **P < 0.01, ***P < 0.001, ****P < 0.0001 by one-way ANOVA followed with Tukey correction.

