Figure 7.
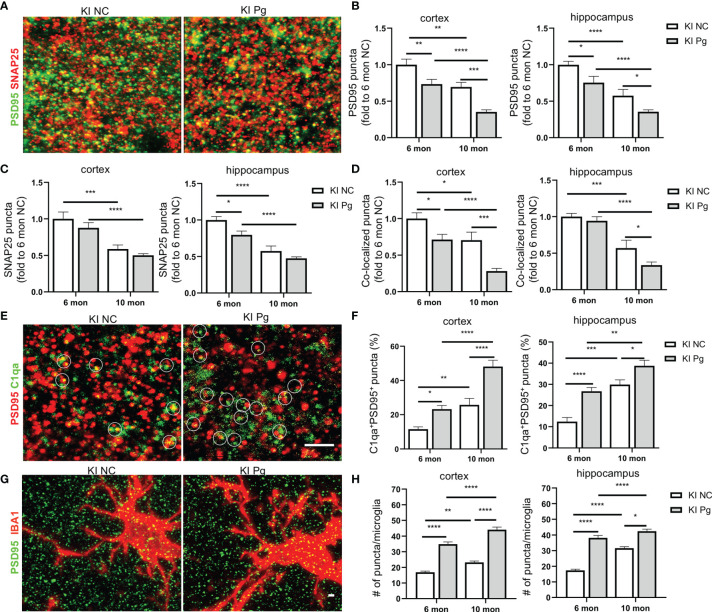
Pg infection enhances microglial elimination of synapses in App KI mice. (A) Representative high magnification Z-stack images showing SNAP 25 (presynaptic marker, red) and PSD95 (postsynaptic marker, green) synaptic terminals in the cortex and hippocampus from non-infected and Pg-infected App KI mice at 10 months of age. (B–D) Quantification of PSD95 puncta (B), SNAP25 puncta (C), and the co-localized PSD95 and SNAP25 puncta (D) in the cortex and hippocampus CA1 regions from non-infected and Pg-infected App KI mice at 6 and 10 months of age. Scale bar: 2 µm. (E) Representative high magnification Z-stack images of C1qa (green) and PSD95 (red) co-stained puncta in the cortex and hippocampus of the brains from non-infected and Pg-infected App KI mice at 10 months of age. Circles show examples of C1qa puncta co-localized with PSD95 puncta. Scale bar: 4 µm. (F) Quantification of co-stained C1qa and PSD95 in the cortex and hippocampus CA1 regions from non-infected and Pg-infected App KI mice at 6 and 10 months of age. (G) Representative high magnification Z-stack images of subicular microglia (IBA1+, red) co-stained with PSD95 (green) from non-infected and Pg-infected App KI mice at the 10 months of age, displaying elimination of synapses by microglia. Scale bar, 5 µm. (H) Quantification of engulfed PSD95 puncta density in microglia in the cortex and hippocampus CA1 regions of the brains from non-infected and Pg-infected App KI mice at 6 and 10 months of age. Data are expressed as mean ± SEM (n=4-7 mice/group). *P < 0.05, **P < 0.01, ***P < 0.001, ****P < 0.0001 by two-way ANOVA followed with Tukey correction.

