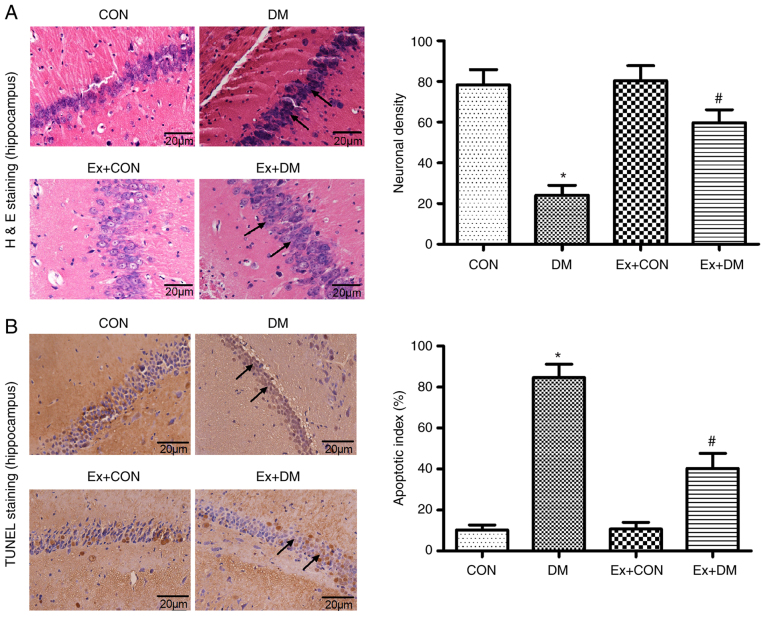
Figure 3.
Pathological changes in H&E-stained and TUNEL-stained hippocampal sections. (A) Representative images of H&E staining from each group (magnification, ×400) and neuronal density in each group calculated from these images. (B) Representative images of TUNEL staining in hippocampal brain slices (magnification, ×400) and apoptotic index of rat neurons in each group calculated from these images. Black arrows indicate morphological characteristics and apoptotic cells. Data are presented as the mean ± SD; n=5; *P<0.05 vs. CON; #P<0.05 vs. DM. CON, control; DM, diabetes mellitus; Ex, exenatide; H&E, hematoxylin and eosin.

