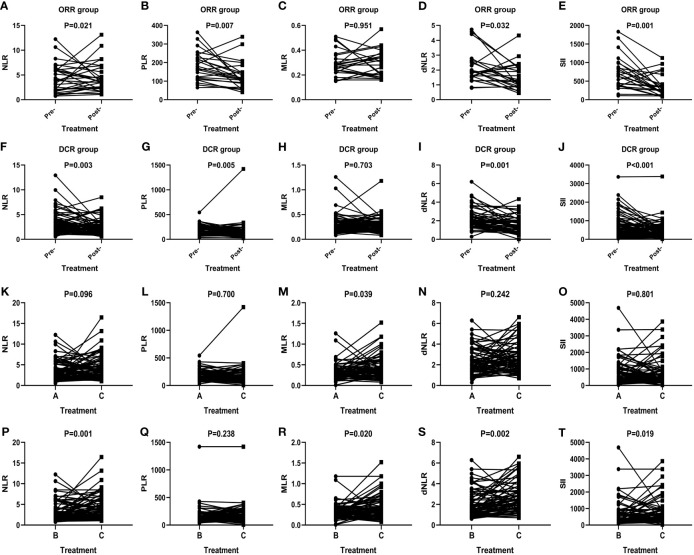
Figure 2.
Efficacy of anti-PD-1 treatment according to the changes in inflammatory markers in AGC patients in the ORR group (A–E), DCR group (F–J), and subgroup analysis groups (K–T). A: Levels of inflammatory markers in patients in the baseline. B: Levels of inflammatory markers in patients with optimal effects. C: Levels of inflammatory markers when disease progression.

