
Figure 2. Association of COVID-19 Vaccination and Symptomatic SARS-CoV-2 Infection by Day Since Vaccination Among Adults 20 Years and Older in the Pre-Delta and Delta Periods.
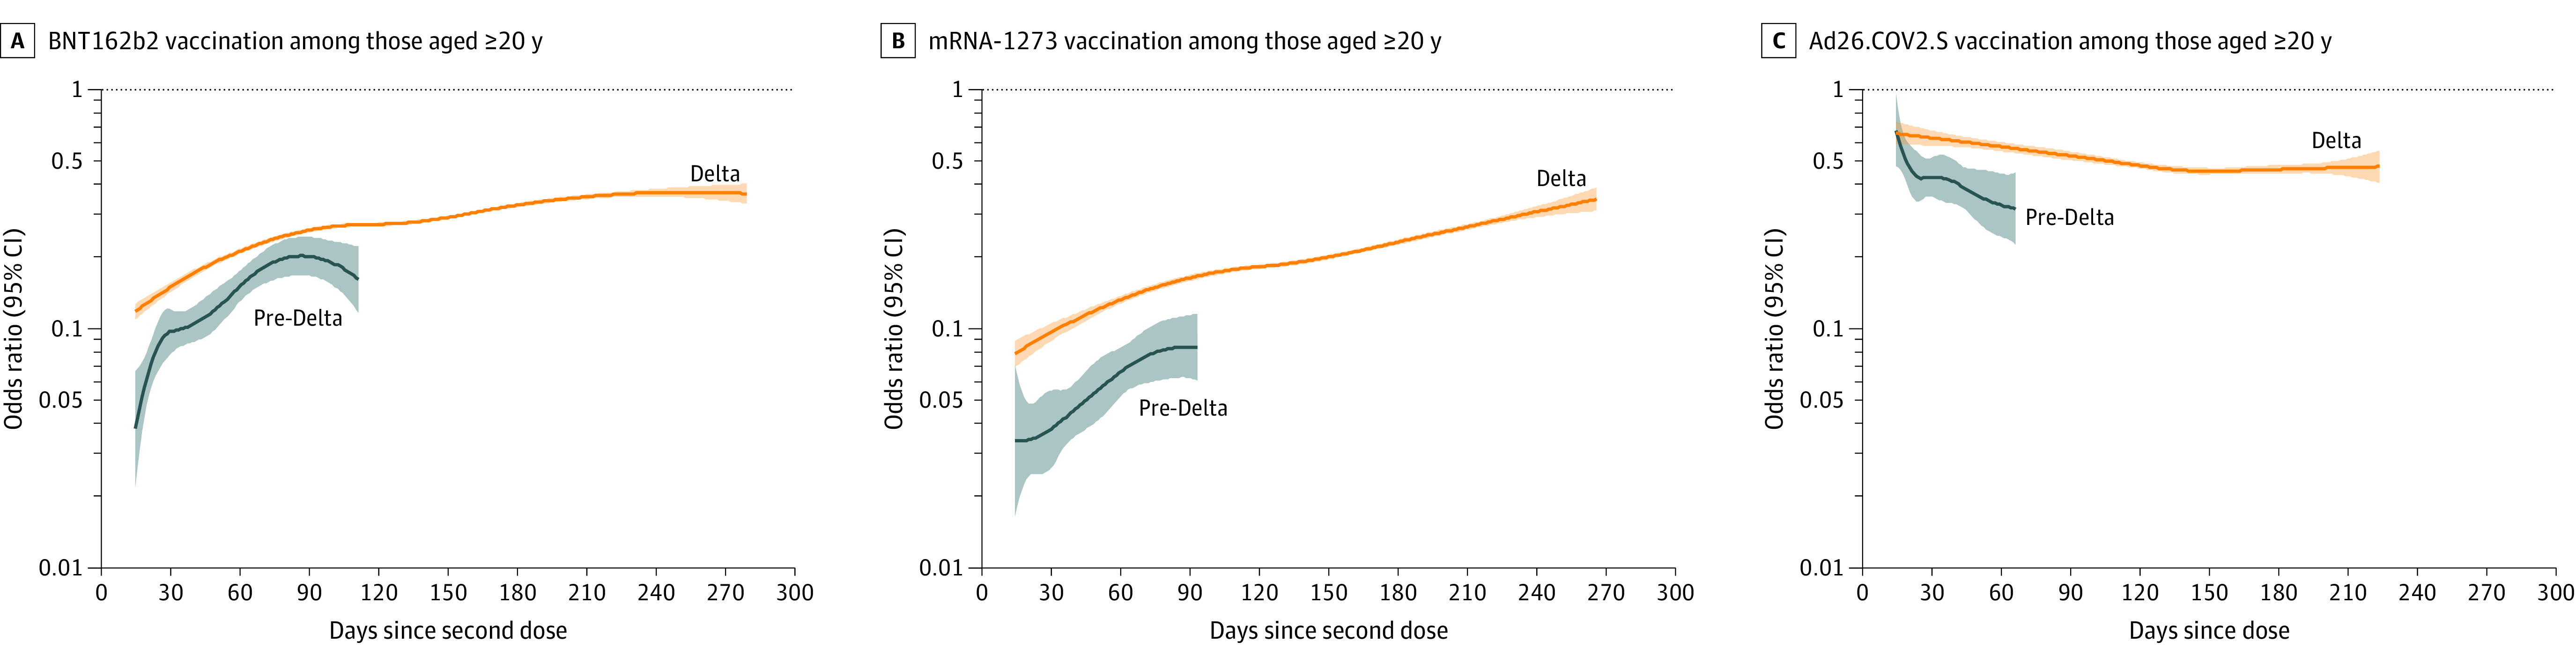
Panels display odds ratios (ORs), plotted on a logarithmic scale, for prior COVID-19 vaccination (by vaccine product) and SARS-CoV-2 test positivity by day since vaccination (starting at day 14 since second mRNA dose or Ad26.COV2.S dose) in the pre-Delta (March 13-May 29, 2021; shown in blue) and Delta (July 18-October 17; shown in orange) periods with 95% CIs (shaded areas). ORs were adjusted for age group, race, ethnicity, sex, testing site state, testing site census tract social vulnerability index, and calendar date as a continuous variable. Tests with missing social vulnerability index were excluded from adjusted analyses. The presented (fitted) curves were truncated on the day after which 10 or fewer cases remained for each product- and period-specific model, beyond which CIs widened. ORs (95% CIs) for day 14, mean of the daily OR estimates from days 14 to 60 (initial OR), and end day for each period are shown in eTable 13 in the Supplement.