
Fig. 5.
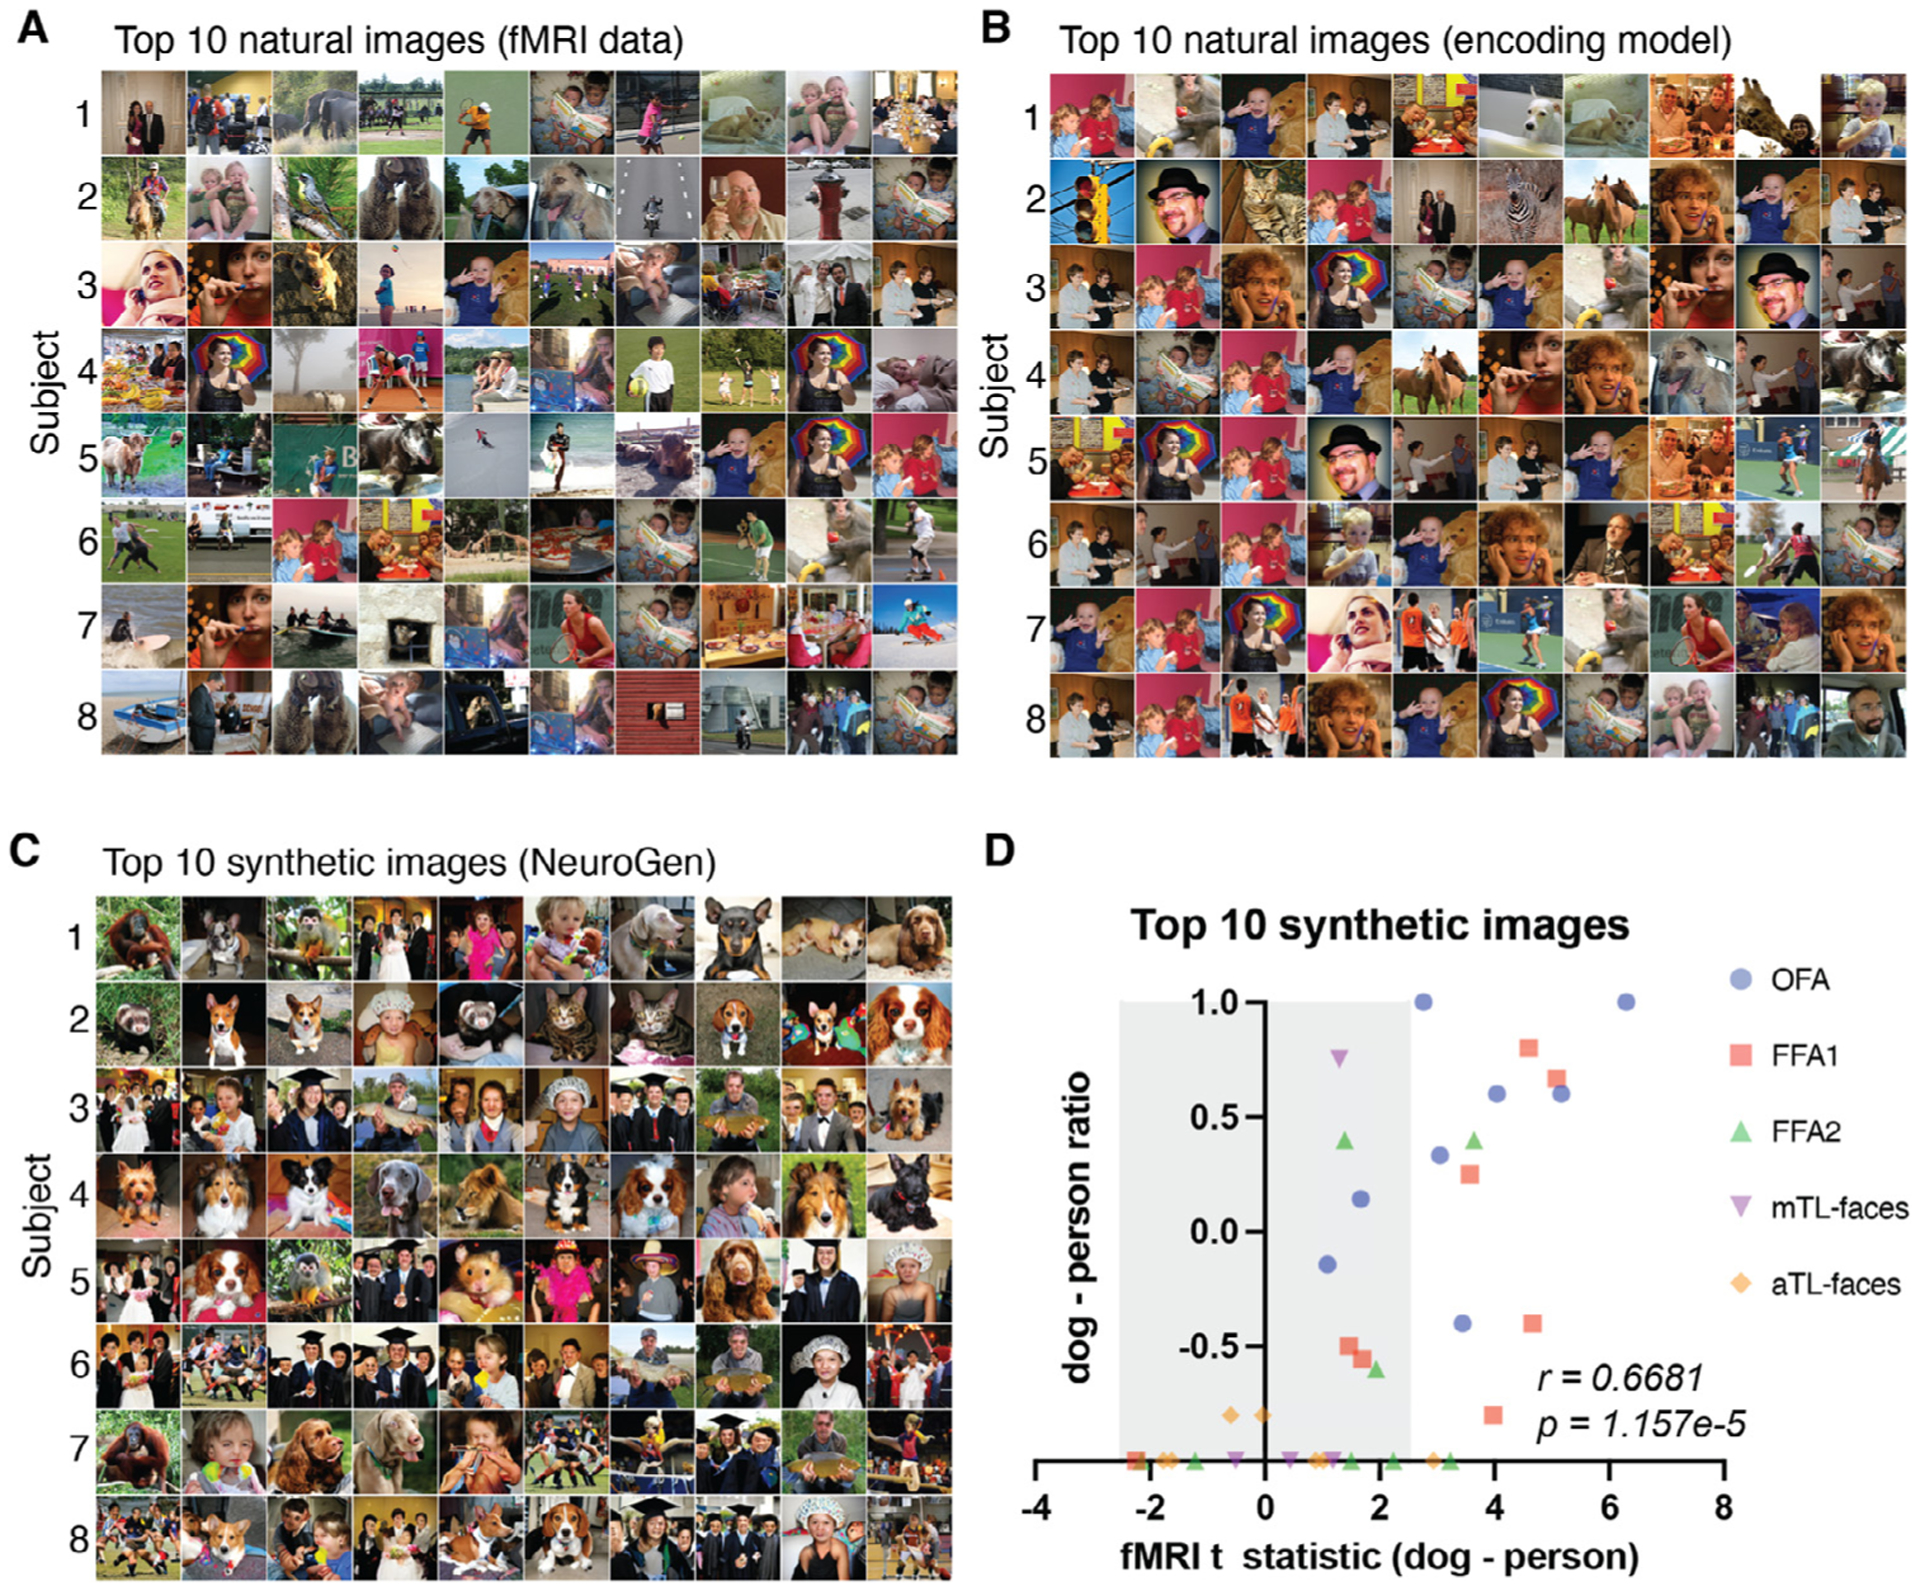
Individual-specific and region-specific differences in face region responses are reflected in and amplified by the NeuroGen framework. A, B and C Sets of images that had the highest activation in FFA1 (fusiform face area 1) for all individuals, one per row, derived from three different sources. A Natural images that have the highest observed activation measured directly via fMRI. B Natural images that have the highest predicted activations from the encoding model. C Synthetic images that were created using NeuroGen. D The x-axis displays the dog vs. person preference from the observed fMRI data, quantified by the t-statistic of observed fMRI activations from all natural dog images compared to the observed activations from all natural people images. The quantities were calculated for each of the five face areas in each of the eight individuals. The y-axes represent the dog vs person preference present in the top 10 synthetic images, calculated by taking the difference in the count of dog images minus the count of person images, divided by the total count of dog and person images. Values close to −1 indicate strong person preference and values close to 1 indicate strong dog preference. Points outside the grey area have t-statistics that are significant after FDR correction. A significant correlation exists between the observed dog-person preference from the entire fMRI dataset and the dog-person preference in the top 10 synthetic images from NeuroGen (Spearman r = 0.6681, p = 1.157e − 5).