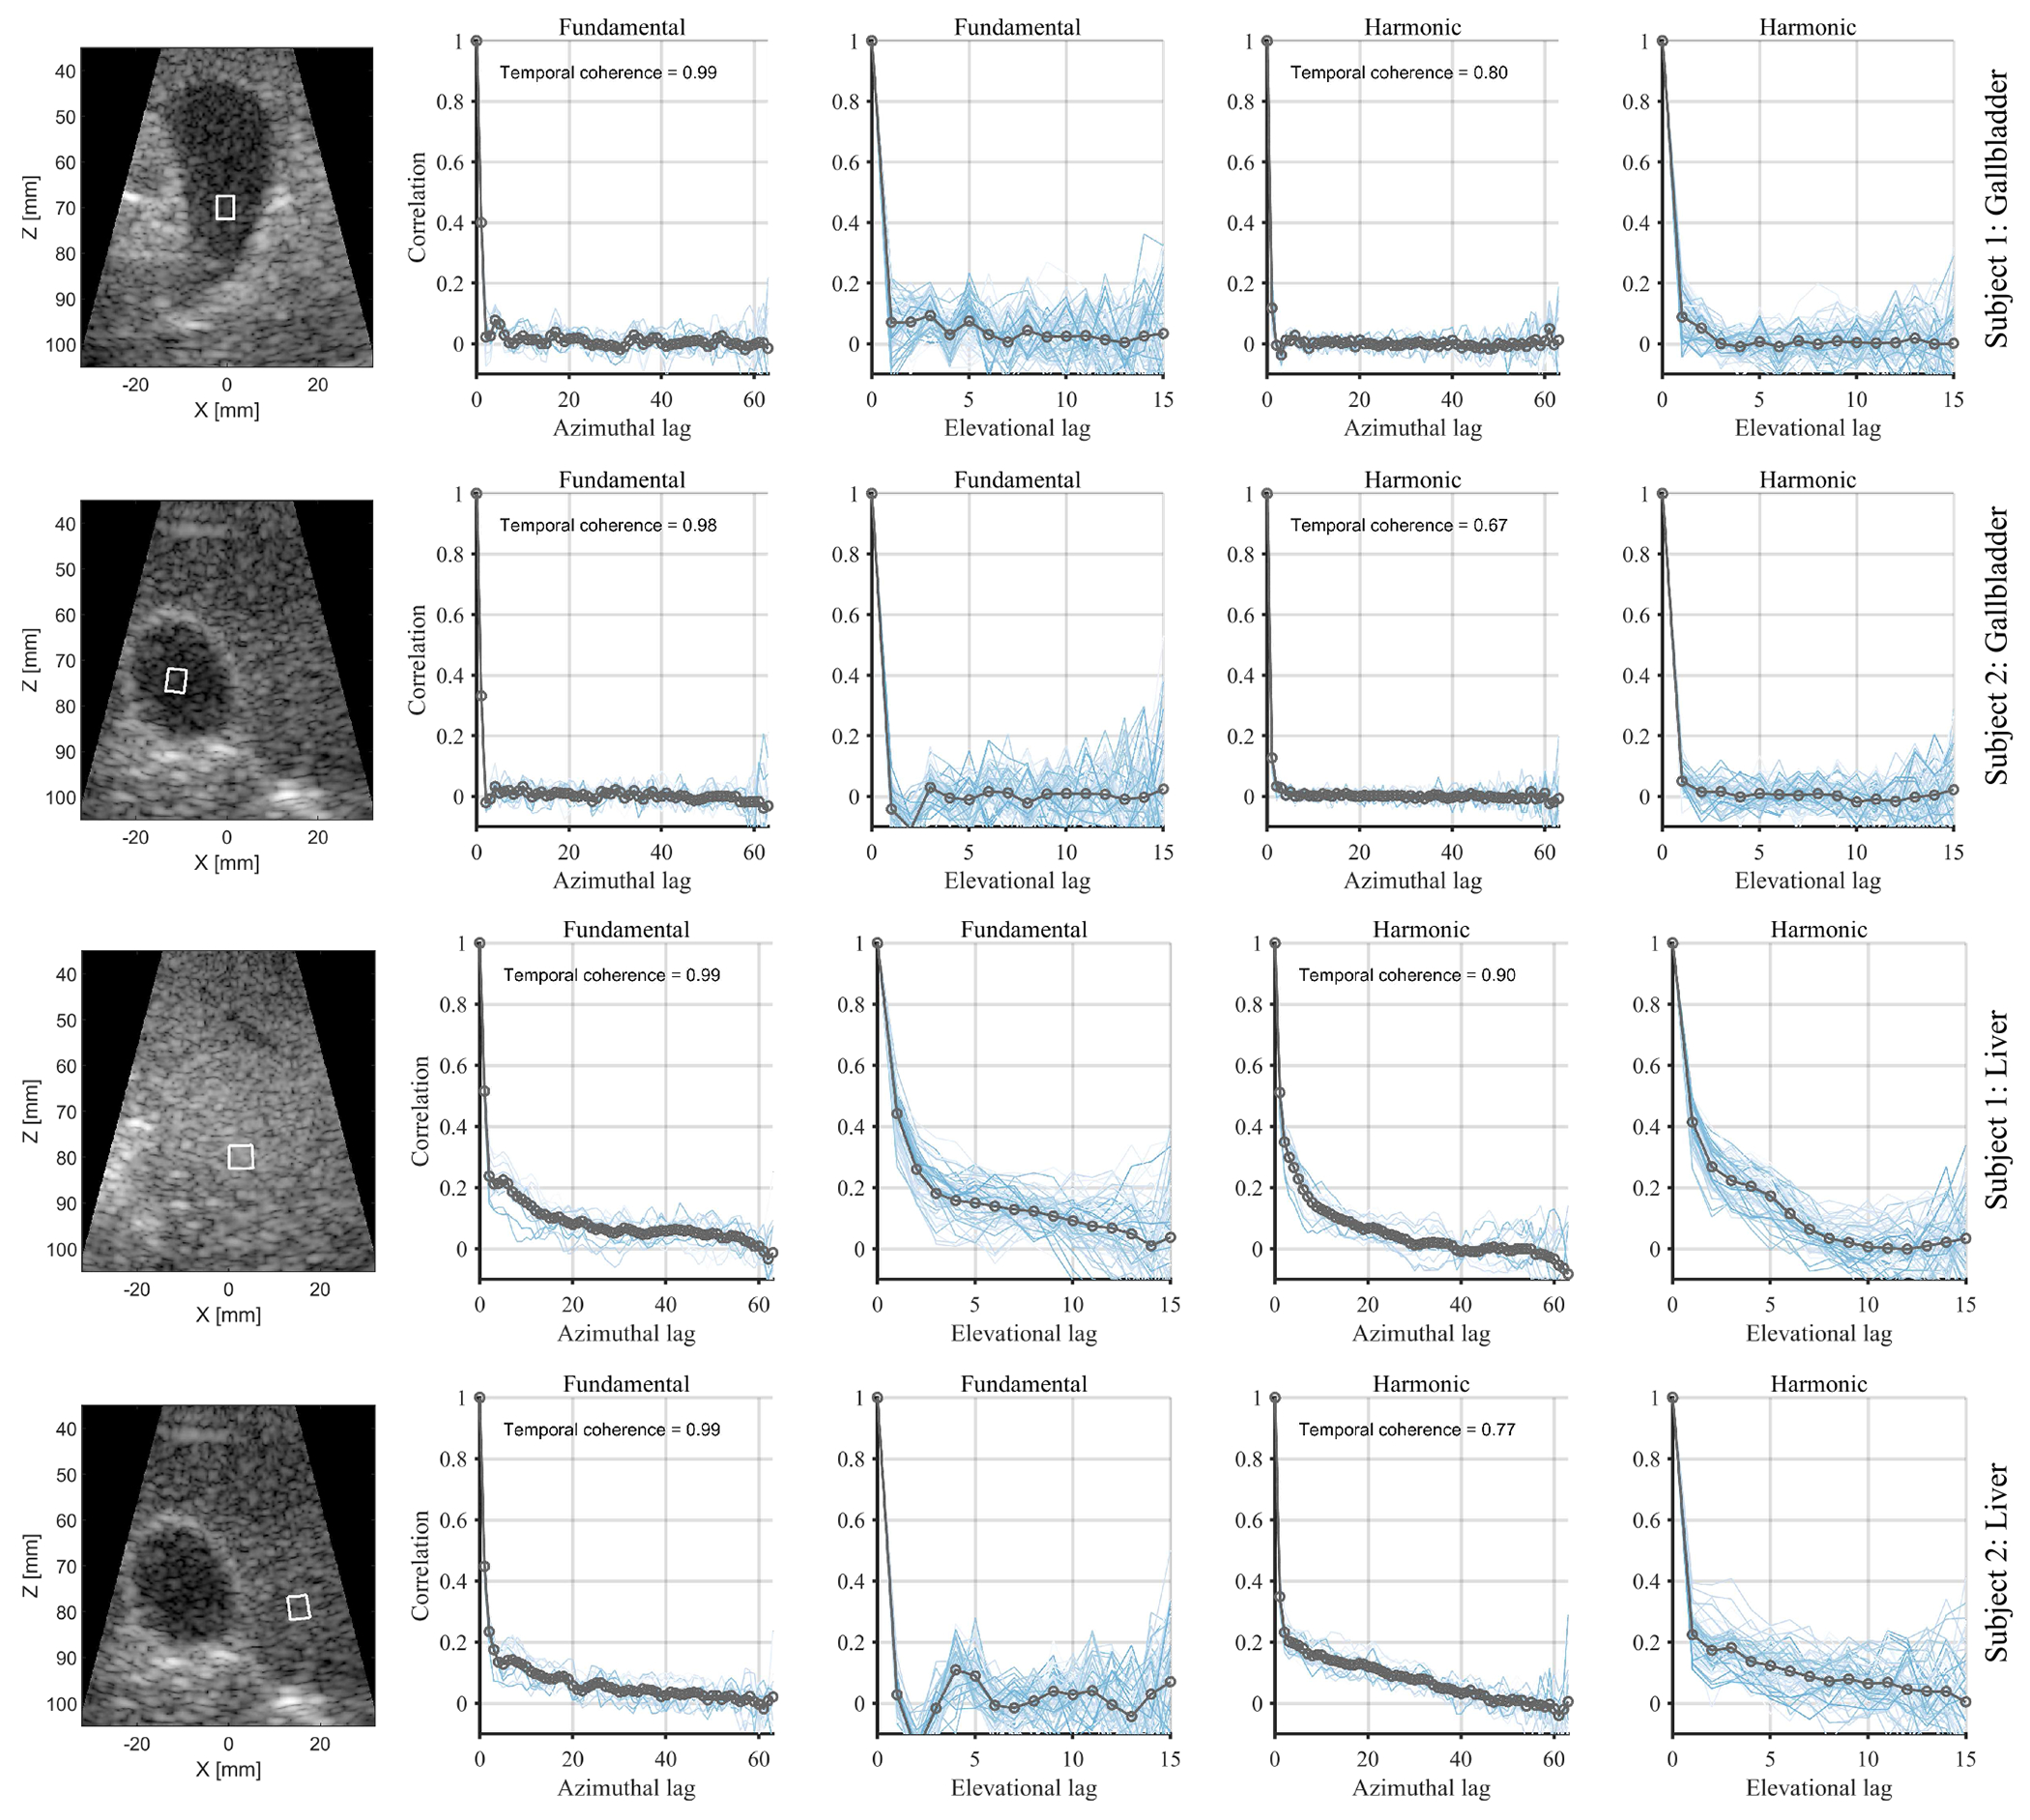
Fig. 8:

In vivo spatial coherence measurements inside the gallbladder and liver of two volunteers. The measurement kernels are shown in the B-mode images (left column) and had equivalent dimensions to those used in the LoSCAN and ALSCAN image formation. Fundamental and harmonic spatial coherence curves are displayed in columns 2-3 and columns 4-5, respectively. The blue lines in the coherence plots correspond to measurements along individual rows or columns of the 2D array, and the gray line is the mean coherence. Measurement kernels inside livers (rows 3-4) were placed at the focal depth. Both measurements in subject 2 (rows 2, 4) were performed within the same cross-section, while in subject 1, we measured liver coherence (row 3) at a different cross-section than the gallbladder (row 1) due to the absence of a large homogeneous area.
