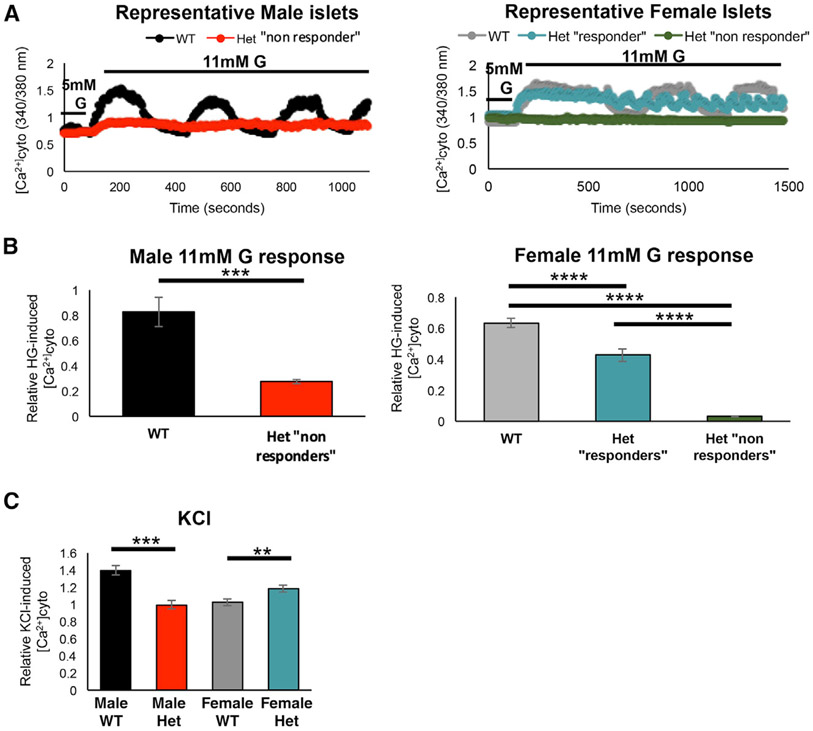
Figure 4. Glucose-induced Ca2+ oscillations and KCl-induced Ca2+ responses are altered in MafAS64F/+ islets.
(A) Representative Fura2 traces show loss of the β cell glucose-induced Ca2+ oscillations (11 mM glucose [G]) in 5-week-old male MafAS64F/+ (Het) islets (red line, “non-responders”). Female MafAS64F/+ islets had 2 different functionally responsive islet populations (“responders,” teal line; non-responders, green line).
(B) Quantitation of male (left; 2-tailed Student t test; ***p < 0.001) and female (right; 1-way ANOVA; ****p < 0.0001) islets showed reduced cytoplasmic Ca2+ following stimulation with 11 mM glucose. The average peak amplitude was quantitated by dividing the first peak ΔCa2+ after 11 mM glucose application by the baseline response at 5 mM glucose.
(C) The Ca2+ response to 30 mM KCl is reduced in male MafAS64F/+ islets but increased in female MafAS64F/+ islets. Representative traces for this experiment are shown in Figure S8. Two-tailed Student t test; **p < 0.01; ***p < 0.001.

