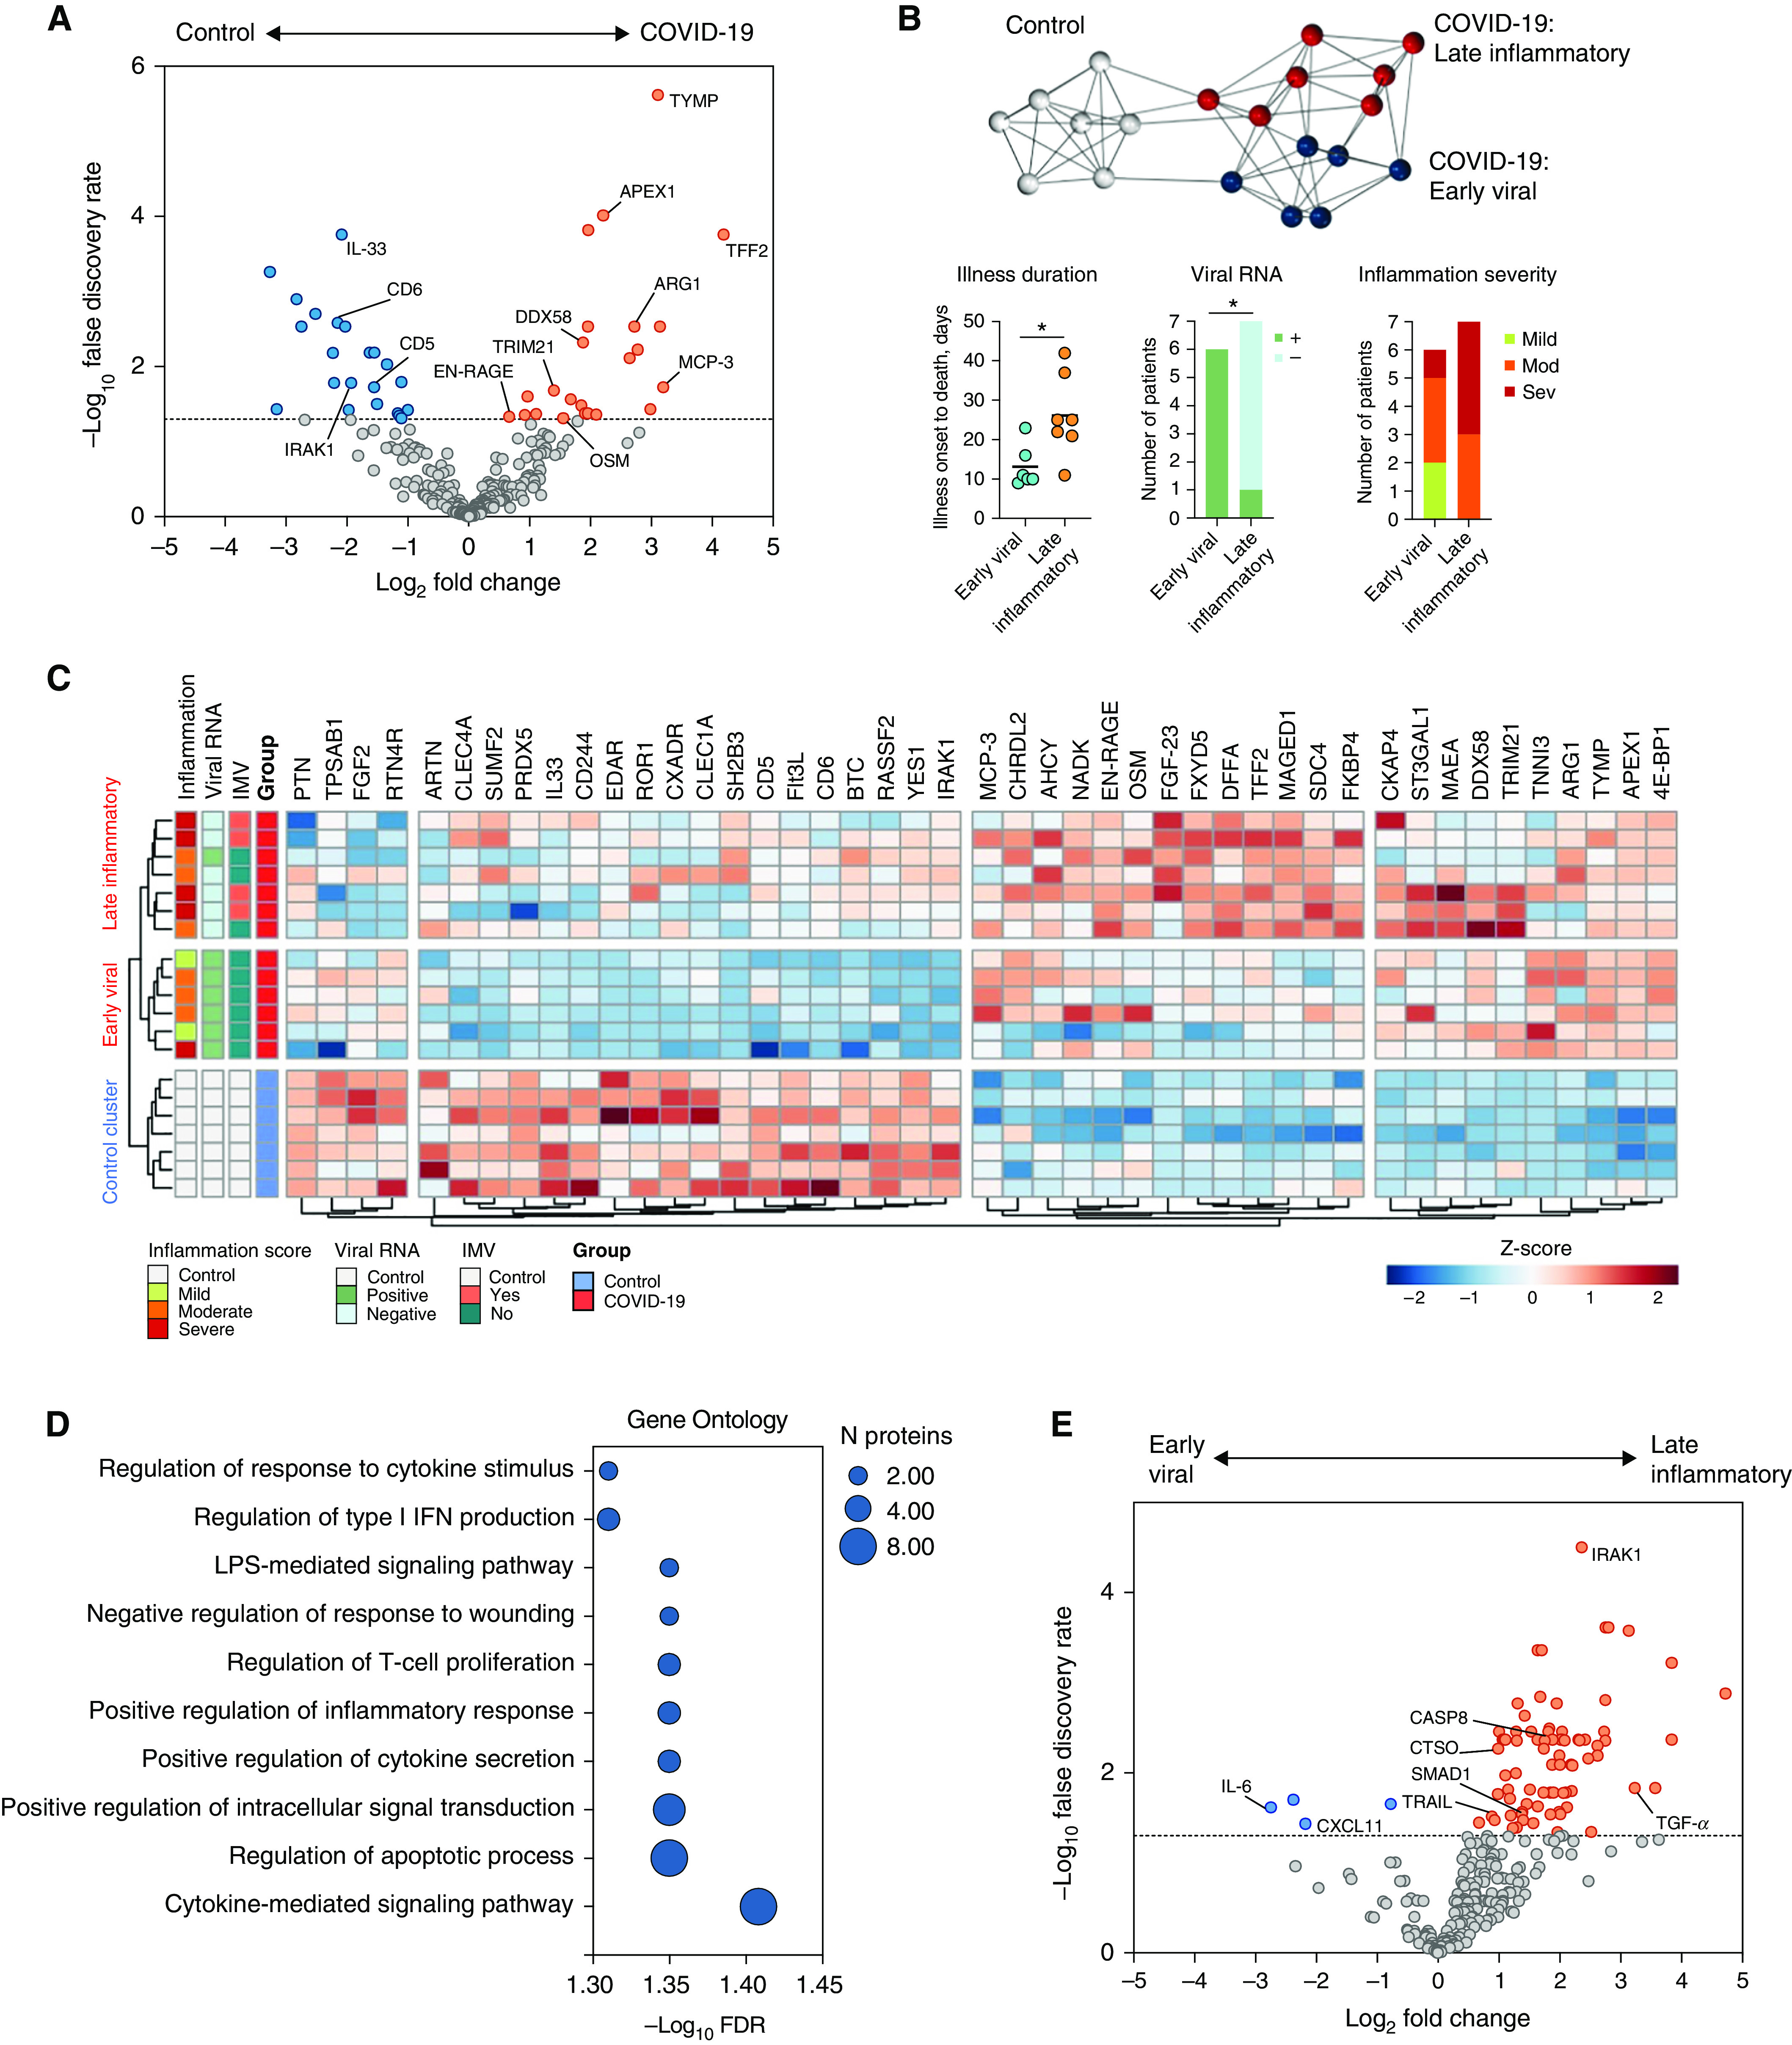
Figure 1.

Proteomic analysis of lung parenchymal tissue in fatal coronavirus disease (COVID-19). (A) Differential protein abundance in patients with COVID-19 compared with control subjects. Volcano plot of log2 fold change difference in protein abundance. Horizontal dotted line indicates false discovery rate of 0.05. Genes are colored based on differential abundance (false discovery rate [FDR] < 0.05): increased (orange), decreased (blue), or no difference (gray). (B) Patient-to-patient network analysis. Lung proteomic data was used to identify three clusters of patients. Edges represent connections with a Pearson correlation value of at least 0.85. The k-nearest neighbors method was used for edge reduction (k = 5). Nodes represent patients and are colored by cluster membership, determined using the Markov clustering algorithm (granularity 2.8). Plots below the network show differences in illness duration before death, presence of viral RNA, and inflammation severity between the two COVID-19 clusters. (C) Clustered heatmap of differential protein abundance. Clusters of proteins (columns) and patients (rows) were determined by hierarchical clustering (reproducing the same patient clusters as the Markov clustering method in panel [B]) and are represented by dendrograms. Metadata relating to each patient are shown by colored annotations: histological inflammation score of lung tissue used in analysis, presence/absence of viral RNA, and receipt of invasive mechanical ventilation (IMV) prior to death. Shading of cells represents the z-score, computed on a protein-by-protein basis. (D) Gene set enrichment of differentially abundant proteins in fatal COVID-19 lung parenchyma (FDR < 0.05) in the Gene Ontology Biological Processes database (no significantly enriched KEGG or WikiPathways pathways were identified). (E) Differential protein abundance in the late inflammatory cluster compared with the early viral cluster. Volcano plot of log2 fold change difference in protein abundance. Horizontal dotted line indicates FDR of 0.05. Genes are colored based on differential abundance (FDR < 0.05): increased (orange), decreased (blue), or no difference (gray).
